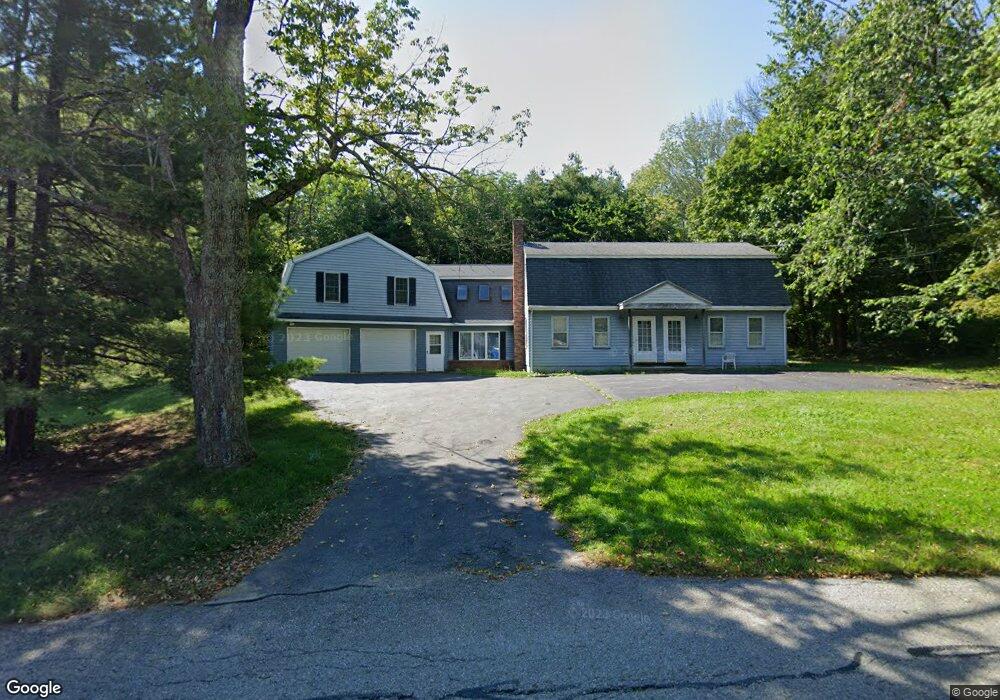
117 Cedar St Sturbridge, MA 01518
Estimated Value: $410,985 - $518,000
4
Beds
2
Baths
2,323
Sq Ft
$205/Sq Ft
Est. Value
About This Home
This home is located at 117 Cedar St, Sturbridge, MA 01518 and is currently estimated at $476,746, approximately $205 per square foot. 117 Cedar St is a home located in Worcester County with nearby schools including Burgess Elementary School, Tantasqua Regional Junior High School, and Tantasqua Regional High School.
Ownership History
Date
Name
Owned For
Owner Type
Purchase Details
Closed on
Sep 15, 2023
Sold by
Klein Kenneth R Est and Klein
Bought by
Mckinstry Cory D and Parent Phillip R
Current Estimated Value
Home Financials for this Owner
Home Financials are based on the most recent Mortgage that was taken out on this home.
Original Mortgage
$304,500
Outstanding Balance
$297,383
Interest Rate
6.9%
Mortgage Type
Purchase Money Mortgage
Estimated Equity
$179,363
Purchase Details
Closed on
Mar 30, 1995
Sold by
Bagdigian Mitchell
Bought by
Klein Kenneth
Home Financials for this Owner
Home Financials are based on the most recent Mortgage that was taken out on this home.
Original Mortgage
$62,000
Interest Rate
8.8%
Mortgage Type
Purchase Money Mortgage
Purchase Details
Closed on
Feb 15, 1994
Sold by
Mcmurray James R and Mcmurray Lois S
Bought by
Ball Kevin J and Ball Susan E
Home Financials for this Owner
Home Financials are based on the most recent Mortgage that was taken out on this home.
Original Mortgage
$111,000
Interest Rate
7.08%
Mortgage Type
Purchase Money Mortgage
Create a Home Valuation Report for This Property
The Home Valuation Report is an in-depth analysis detailing your home's value as well as a comparison with similar homes in the area
Home Values in the Area
Average Home Value in this Area
Purchase History
| Date | Buyer | Sale Price | Title Company |
|---|---|---|---|
| Mckinstry Cory D | $360,000 | None Available | |
| Klein Kenneth | $112,000 | -- | |
| Ball Kevin J | $139,000 | -- |
Source: Public Records
Mortgage History
| Date | Status | Borrower | Loan Amount |
|---|---|---|---|
| Open | Mckinstry Cory D | $304,500 | |
| Previous Owner | Ball Kevin J | $62,000 | |
| Previous Owner | Ball Kevin J | $111,000 |
Source: Public Records
Tax History
| Year | Tax Paid | Tax Assessment Tax Assessment Total Assessment is a certain percentage of the fair market value that is determined by local assessors to be the total taxable value of land and additions on the property. | Land | Improvement |
|---|---|---|---|---|
| 2025 | $5,560 | $349,000 | $72,600 | $276,400 |
| 2024 | $5,626 | $341,200 | $71,100 | $270,100 |
| 2023 | $5,871 | $324,900 | $62,300 | $262,600 |
| 2022 | $5,483 | $286,300 | $56,200 | $230,100 |
| 2021 | $5,151 | $270,800 | $53,600 | $217,200 |
| 2020 | $5,151 | $270,800 | $53,600 | $217,200 |
| 2019 | $4,960 | $259,000 | $55,400 | $203,600 |
| 2018 | $4,530 | $233,000 | $52,700 | $180,300 |
| 2017 | $4,318 | $222,600 | $50,800 | $171,800 |
| 2016 | $3,627 | $188,800 | $49,200 | $139,600 |
| 2015 | $3,633 | $188,800 | $49,200 | $139,600 |
Source: Public Records
Map
Nearby Homes
- 46 Westwood Dr
- 43 Mountain Brook Rd
- 26 Cedar Lake Dr
- 7 Crescent Way Unit 105
- 7 Crescent Way Unit 315
- 73 New Boston Rd
- 19 Arnold Rd
- 5 Hinman St Unit 4
- 368 Main St
- 19 Preserve Way
- 504 Main St
- 365 Main St Unit 3
- 537 Main St
- 9 Haynes St
- 1 Chase Rd
- 87 Holland Rd
- 7 Woodlawn Dr
- 0 Fiske Hill Rd
- Lot B-6 River Rd
- 8 Blueberry Ln
Your Personal Tour Guide
Ask me questions while you tour the home.