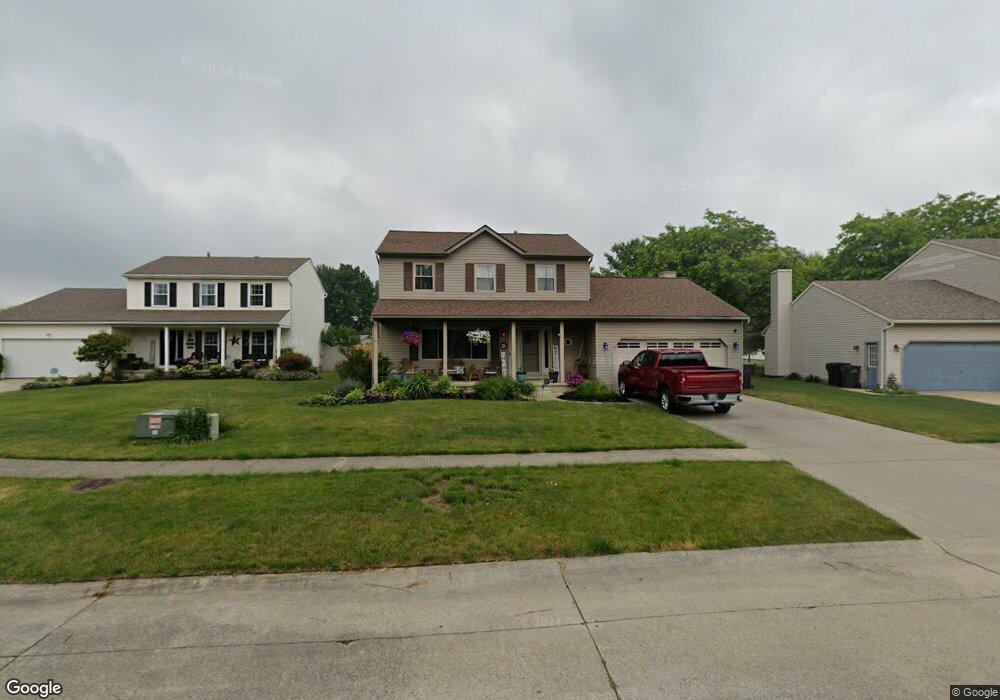
117 Cumberland Ct Elyria, OH 44035
Estimated Value: $275,000 - $298,000
3
Beds
3
Baths
1,750
Sq Ft
$164/Sq Ft
Est. Value
About This Home
This home is located at 117 Cumberland Ct, Elyria, OH 44035 and is currently estimated at $286,682, approximately $163 per square foot. 117 Cumberland Ct is a home located in Lorain County with nearby schools including Midview West Elementary School, Midview North Elementary School, and Midview Middle School.
Ownership History
Date
Name
Owned For
Owner Type
Purchase Details
Closed on
May 24, 2013
Sold by
Pejeau Nicole M and Flachbart Nicole M
Bought by
Flachbart Robert J and Flachbart Nicole M
Current Estimated Value
Home Financials for this Owner
Home Financials are based on the most recent Mortgage that was taken out on this home.
Original Mortgage
$9,400
Outstanding Balance
$2,037
Interest Rate
3.38%
Mortgage Type
Future Advance Clause Open End Mortgage
Estimated Equity
$284,645
Purchase Details
Closed on
Mar 19, 2010
Sold by
First Place Bank
Bought by
Pejeau Nicole M
Home Financials for this Owner
Home Financials are based on the most recent Mortgage that was taken out on this home.
Original Mortgage
$98,188
Outstanding Balance
$66,745
Interest Rate
5.5%
Mortgage Type
FHA
Estimated Equity
$219,937
Purchase Details
Closed on
Jan 12, 2010
Sold by
Chury Brian D
Bought by
First Place Bank
Create a Home Valuation Report for This Property
The Home Valuation Report is an in-depth analysis detailing your home's value as well as a comparison with similar homes in the area
Home Values in the Area
Average Home Value in this Area
Purchase History
| Date | Buyer | Sale Price | Title Company |
|---|---|---|---|
| Flachbart Robert J | -- | Lawyers Title Co | |
| Pejeau Nicole M | $100,000 | Lawyers Title Co | |
| First Place Bank | $100,000 | Lawyers Title |
Source: Public Records
Mortgage History
| Date | Status | Borrower | Loan Amount |
|---|---|---|---|
| Open | Flachbart Robert J | $9,400 | |
| Open | Pejeau Nicole M | $98,188 |
Source: Public Records
Tax History
| Year | Tax Paid | Tax Assessment Tax Assessment Total Assessment is a certain percentage of the fair market value that is determined by local assessors to be the total taxable value of land and additions on the property. | Land | Improvement |
|---|---|---|---|---|
| 2024 | $3,555 | $83,790 | $17,220 | $66,570 |
| 2023 | $3,033 | $65,709 | $15,855 | $49,854 |
| 2022 | $3,056 | $65,709 | $15,855 | $49,854 |
| 2021 | $3,058 | $65,709 | $15,855 | $49,854 |
| 2020 | $2,657 | $52,910 | $12,770 | $40,140 |
| 2019 | $2,647 | $52,910 | $12,770 | $40,140 |
| 2018 | $2,679 | $52,910 | $12,770 | $40,140 |
| 2017 | $2,390 | $44,350 | $10,020 | $34,330 |
| 2016 | $2,388 | $44,350 | $10,020 | $34,330 |
| 2015 | $2,402 | $44,350 | $10,020 | $34,330 |
| 2014 | $2,375 | $43,050 | $9,730 | $33,320 |
| 2013 | $2,843 | $49,770 | $9,730 | $40,040 |
Source: Public Records
Map
Nearby Homes
- 246 Syracuse Ct
- 148 Bentley Dr Unit 25
- 418 Carol Ln
- 128 Richmond Ct
- 436 Bayberry Dr
- 134 Richmond Ct
- 310 Carol Ln
- 124 Oakley Green Dr
- 121 Oakley Green Dr Unit 13
- 746 Delaware Ave
- 832 S Logan St
- 219 Bridgeport Dr Unit 35
- 523 Purdue Ave
- 817 Boston Ave
- 133 Gleneagle Dr Unit 47
- 800 Boston Ave
- 1210 Prospect St
- 602 Still Water Blvd
- 158 Stonecrest Trail
- 106 Stonecrest Trail
- 111 Cumberland Ct
- 121 Cumberland Ct
- 107 Cumberland Ct
- 125 Cumberland Ct
- 114 Cumberland Ct
- 108 Cumberland Ct
- 127 Cumberland Ct
- 105 Cumberland Ct
- 102 Cumberland Ct
- 104 Cumberland Ct
- 131 Cumberland Ct
- 267 Rauscher Ct
- 211 Bayberry Dr
- 136 Cumberland Ct
- 137 Cumberland Ct
- 530 Hampton Dr
- 217 Bayberry Dr
- 1526 Abbe Rd S
- 1520 Abbe Rd S
- 526 Hampton Dr
Your Personal Tour Guide
Ask me questions while you tour the home.