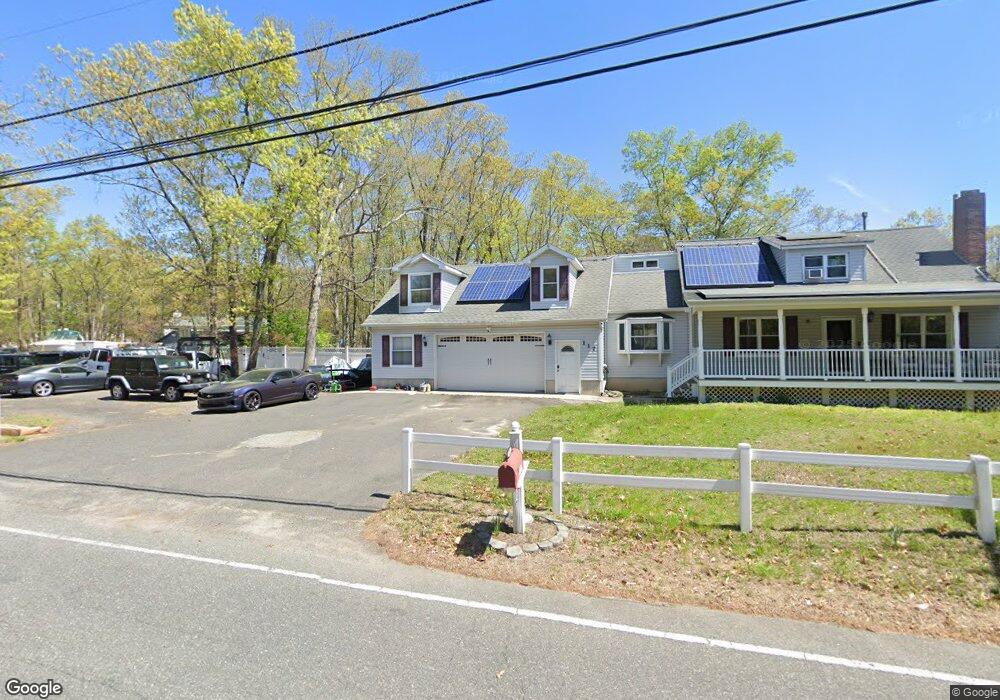
117 Driftway Rd Howell, NJ 07731
Southard NeighborhoodEstimated Value: $685,000 - $811,000
4
Beds
3
Baths
2,446
Sq Ft
$306/Sq Ft
Est. Value
About This Home
This home is located at 117 Driftway Rd, Howell, NJ 07731 and is currently estimated at $747,989, approximately $305 per square foot. 117 Driftway Rd is a home located in Monmouth County with nearby schools including Taunton School, Aldrich School, and Howell Township Middle School South.
Ownership History
Date
Name
Owned For
Owner Type
Purchase Details
Closed on
Mar 31, 2025
Sold by
Rother Brenda T and Rother Dennis J
Bought by
Rother Dennis J
Current Estimated Value
Home Financials for this Owner
Home Financials are based on the most recent Mortgage that was taken out on this home.
Original Mortgage
$303,000
Outstanding Balance
$300,283
Interest Rate
6.67%
Mortgage Type
New Conventional
Estimated Equity
$447,706
Purchase Details
Closed on
Dec 29, 1999
Sold by
Privette James
Bought by
Rother Dennis and Rother Brenda
Home Financials for this Owner
Home Financials are based on the most recent Mortgage that was taken out on this home.
Original Mortgage
$154,800
Interest Rate
7.83%
Purchase Details
Closed on
Apr 13, 1998
Sold by
Knight Allen
Bought by
Privette James and Privette Donna
Create a Home Valuation Report for This Property
The Home Valuation Report is an in-depth analysis detailing your home's value as well as a comparison with similar homes in the area
Home Values in the Area
Average Home Value in this Area
Purchase History
| Date | Buyer | Sale Price | Title Company |
|---|---|---|---|
| Rother Dennis J | -- | Realsafe Title | |
| Rother Dennis J | -- | Realsafe Title | |
| Rother Dennis | $172,000 | -- | |
| Privette James | $50,000 | -- |
Source: Public Records
Mortgage History
| Date | Status | Borrower | Loan Amount |
|---|---|---|---|
| Open | Rother Dennis J | $303,000 | |
| Closed | Rother Dennis J | $303,000 | |
| Previous Owner | Rother Dennis | $154,800 |
Source: Public Records
Tax History
| Year | Tax Paid | Tax Assessment Tax Assessment Total Assessment is a certain percentage of the fair market value that is determined by local assessors to be the total taxable value of land and additions on the property. | Land | Improvement |
|---|---|---|---|---|
| 2025 | $9,153 | $595,300 | $219,800 | $375,500 |
| 2024 | $8,959 | $514,800 | $146,200 | $368,600 |
| 2023 | $8,959 | $481,400 | $121,400 | $360,000 |
| 2022 | $9,411 | $447,800 | $104,600 | $343,200 |
| 2021 | $9,411 | $409,900 | $104,600 | $305,300 |
| 2020 | $9,437 | $406,400 | $104,600 | $301,800 |
| 2019 | $9,429 | $398,500 | $101,800 | $296,700 |
| 2018 | $8,745 | $367,300 | $84,400 | $282,900 |
| 2017 | $8,635 | $358,600 | $84,400 | $274,200 |
| 2016 | $8,441 | $347,100 | $79,800 | $267,300 |
| 2015 | $8,752 | $356,200 | $95,800 | $260,400 |
| 2014 | $7,594 | $286,800 | $79,800 | $207,000 |
Source: Public Records
Map
Nearby Homes
- 42 Brown Rd
- 57 Church Rd
- 29 Sweet Gum Rd
- 40 Brookwood Pkwy
- 41 Sweet Gum Rd
- 3 Colorado Dr
- 47 Sweet Gum Rd
- 53 Sweet Gum Rd
- 9 Hawk Ct
- 8 Trinity Place
- 652 Hope Chapel Rd
- 1501 Pine Park Ave
- 100 Avis Ave
- 132 Saint Katherine Place
- 26 Oregon Ave
- 28 Oregon Ave
- 901 Bethel Church Rd
- 606 W Kennedy Blvd
- 284 Friendship Rd
- 254 Alexander Ave
Your Personal Tour Guide
Ask me questions while you tour the home.