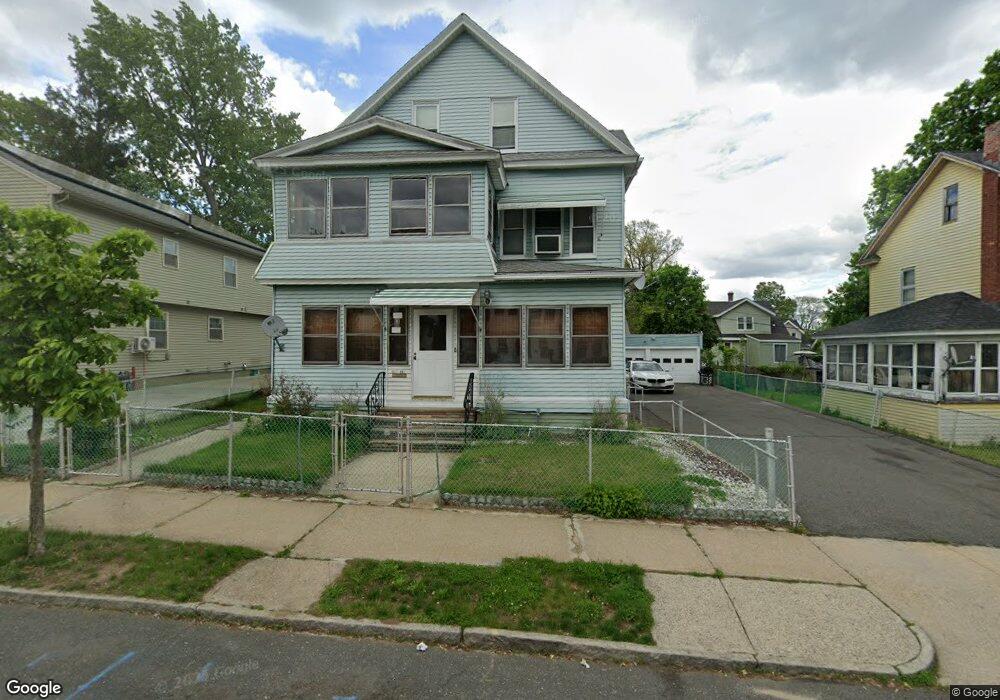
117 Dunmoreland St Springfield, MA 01109
Upper Hill NeighborhoodEstimated Value: $342,000 - $445,000
8
Beds
3
Baths
3,494
Sq Ft
$111/Sq Ft
Est. Value
About This Home
This home is located at 117 Dunmoreland St, Springfield, MA 01109 and is currently estimated at $389,327, approximately $111 per square foot. 117 Dunmoreland St is a home located in Hampden County with nearby schools including Mary M. Walsh Elementary School, M Marcus Kiley Middle, and Springfield High School of Science and Technology.
Ownership History
Date
Name
Owned For
Owner Type
Purchase Details
Closed on
Feb 7, 2022
Sold by
Johnson Donna S and Johnson Jessica
Bought by
Johnson Jessica
Current Estimated Value
Purchase Details
Closed on
Jan 26, 2022
Sold by
Johnson Donna S
Bought by
Johnson Donna S and Johnson Jessica
Purchase Details
Closed on
Oct 24, 2007
Sold by
Johnson Quity G
Bought by
Johnson Donna S and Johnson Quity
Home Financials for this Owner
Home Financials are based on the most recent Mortgage that was taken out on this home.
Original Mortgage
$121,650
Interest Rate
6.39%
Mortgage Type
Purchase Money Mortgage
Create a Home Valuation Report for This Property
The Home Valuation Report is an in-depth analysis detailing your home's value as well as a comparison with similar homes in the area
Home Values in the Area
Average Home Value in this Area
Purchase History
| Date | Buyer | Sale Price | Title Company |
|---|---|---|---|
| Johnson Jessica | -- | None Available | |
| Johnson Jessica | -- | None Available | |
| Johnson Donna S | -- | None Available | |
| Johnson Donna S | -- | None Available | |
| Johnson Donna S | -- | -- | |
| Johnson Donna S | -- | -- | |
| Johnson Donna S | -- | -- |
Source: Public Records
Mortgage History
| Date | Status | Borrower | Loan Amount |
|---|---|---|---|
| Previous Owner | Johnson Donna S | $5,000 | |
| Previous Owner | Johnson Donna S | $121,650 |
Source: Public Records
Tax History
| Year | Tax Paid | Tax Assessment Tax Assessment Total Assessment is a certain percentage of the fair market value that is determined by local assessors to be the total taxable value of land and additions on the property. | Land | Improvement |
|---|---|---|---|---|
| 2025 | $4,804 | $306,400 | $31,100 | $275,300 |
| 2024 | $4,309 | $268,300 | $31,100 | $237,200 |
| 2023 | $3,968 | $232,700 | $28,300 | $204,400 |
| 2022 | $4,101 | $217,900 | $26,400 | $191,500 |
| 2021 | $3,349 | $177,200 | $18,700 | $158,500 |
| 2020 | $3,414 | $174,800 | $18,700 | $156,100 |
| 2019 | $3,143 | $159,700 | $16,000 | $143,700 |
| 2018 | $3,066 | $155,800 | $16,000 | $139,800 |
| 2017 | $2,959 | $150,500 | $15,000 | $135,500 |
| 2016 | $2,570 | $130,700 | $15,000 | $115,700 |
| 2015 | $2,520 | $128,100 | $15,000 | $113,100 |
Source: Public Records
Map
Nearby Homes
- 124-126 Westford Cir
- 21 Westford Cir
- 19 Westford Ave
- 135-137 Suffolk St
- 189 Northampton Ave
- 283 Wilbraham Rd
- 62-64 Bristol St
- 31-33 Suffolk St
- 89 Bristol St
- 48-50 Dresden St
- 111 Marlborough St
- 290 Quincy St
- 0 NS (24) Alden St
- 25 Dresden St
- 46 Mapledell St
- 41 Olive St
- 65 Montrose St
- 52-56 Andrew St
- 15 Kenyon St
- 87 Fenwick St
- 109 Dunmoreland St
- 111 Dunmoreland St
- 103 Dunmoreland St
- 123 Dunmoreland St
- 114 Albemarle St
- 118 Albemarle St Unit 120
- 110 Dunmoreland St Unit 112
- 110 Dunmoreland St Unit 1
- 116 Dunmoreland St Unit 118
- 106 Albemarle St Unit 108
- 99 Dunmoreland St
- 124 Albemarle St
- 129 Dunmoreland St
- 104 Dunmoreland St Unit 106
- 104-106 Dunmoreland St
- 124 Dunmoreland St Unit 126
- 130 Albemarle St
- 98 Dunmoreland St Unit 100
- 130 Dunmoreland St
- 100 Albemarle St Unit 102
Your Personal Tour Guide
Ask me questions while you tour the home.