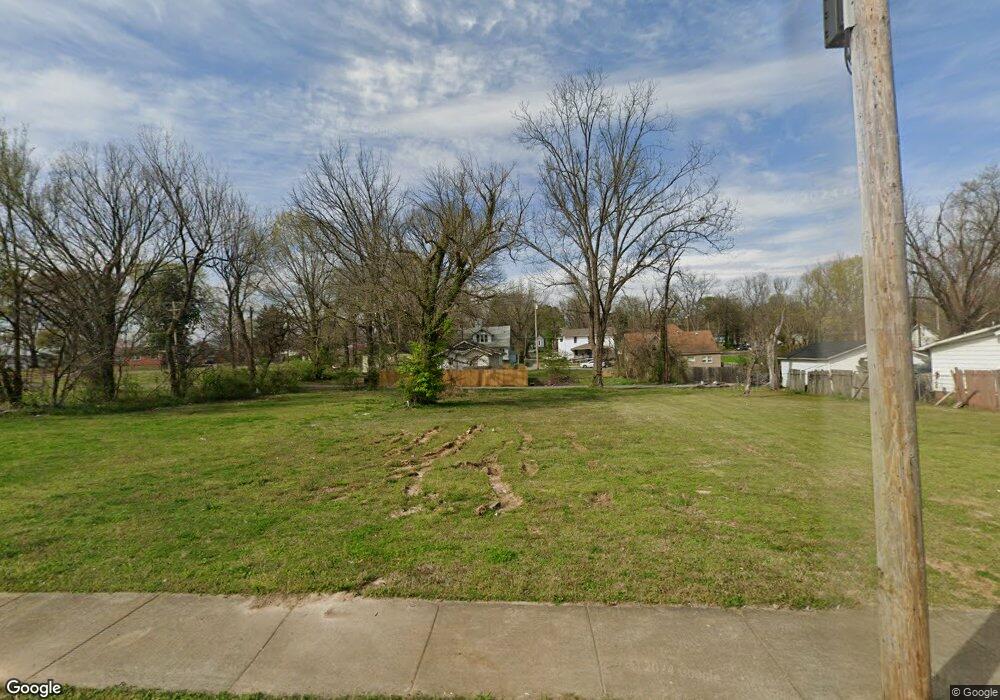
117 Dupree St Jackson, TN 38301
Downtown Jackson NeighborhoodEstimated Value: $63,027
3
Beds
2
Baths
1,356
Sq Ft
$46/Sq Ft
Est. Value
About This Home
This home is located at 117 Dupree St, Jackson, TN 38301 and is currently estimated at $63,027, approximately $46 per square foot. 117 Dupree St is a home located in Madison County with nearby schools including Isaac Lane Technology Magnet Elementary School and Liberty Technology Magnet High School.
Ownership History
Date
Name
Owned For
Owner Type
Purchase Details
Closed on
Oct 25, 2019
Sold by
Hardiman Jamar and Hardiman Crysta
Bought by
Jackson Community Redevelopment Agency
Current Estimated Value
Purchase Details
Closed on
Apr 9, 2010
Sold by
Lh Property Svcs Llc
Bought by
Hardiman Jamar
Purchase Details
Closed on
Jan 28, 2010
Sold by
The Bank Of New York Mello
Bought by
Lh Property Svcs Llc
Purchase Details
Closed on
May 7, 2009
Sold by
Williams Sharon L
Bought by
The Bank Of New York Mellon
Purchase Details
Closed on
Sep 11, 2001
Sold by
Waymond Long
Bought by
Henry Smith
Purchase Details
Closed on
Mar 26, 2001
Sold by
Brpwm Matthew S
Bought by
Williams Sharol L
Purchase Details
Closed on
Apr 21, 1998
Bought by
Sharon Williams and Brown Matthew
Purchase Details
Closed on
May 13, 1997
Bought by
J E Tweedy Enterprise Trus
Purchase Details
Closed on
Mar 11, 1980
Bought by
Walker Frank
Purchase Details
Closed on
Feb 19, 1980
Purchase Details
Closed on
Nov 17, 1970
Create a Home Valuation Report for This Property
The Home Valuation Report is an in-depth analysis detailing your home's value as well as a comparison with similar homes in the area
Home Values in the Area
Average Home Value in this Area
Purchase History
| Date | Buyer | Sale Price | Title Company |
|---|---|---|---|
| Jackson Community Redevelopment Agency | $35,700 | None Available | |
| Hardiman Jamar | $1,250 | -- | |
| Lh Property Svcs Llc | $2,000 | -- | |
| The Bank Of New York Mellon | $12,740 | -- | |
| Henry Smith | $10,000 | -- | |
| Williams Sharol L | -- | -- | |
| Sharon Williams | $36,000 | -- | |
| J E Tweedy Enterprise Trus | $19,300 | -- | |
| J E Tweedy Enterprise Trus | -- | -- | |
| Walker Frank | -- | -- | |
| -- | -- | -- | |
| -- | -- | -- |
Source: Public Records
Tax History Compared to Growth
Tax History
| Year | Tax Paid | Tax Assessment Tax Assessment Total Assessment is a certain percentage of the fair market value that is determined by local assessors to be the total taxable value of land and additions on the property. | Land | Improvement |
|---|---|---|---|---|
| 2024 | -- | -- | -- | -- |
| 2022 | $0 | $0 | $0 | $0 |
| 2021 | $385 | $0 | $0 | $0 |
| 2020 | $0 | $0 | $0 | $0 |
| 2019 | $385 | $0 | $0 | $0 |
| 2018 | $385 | $8,925 | $1,000 | $7,925 |
| 2017 | $365 | $8,275 | $1,000 | $7,275 |
| 2016 | $340 | $8,275 | $1,000 | $7,275 |
| 2015 | $340 | $8,275 | $1,000 | $7,275 |
| 2014 | $340 | $8,275 | $1,000 | $7,275 |
Source: Public Records
Map
Nearby Homes