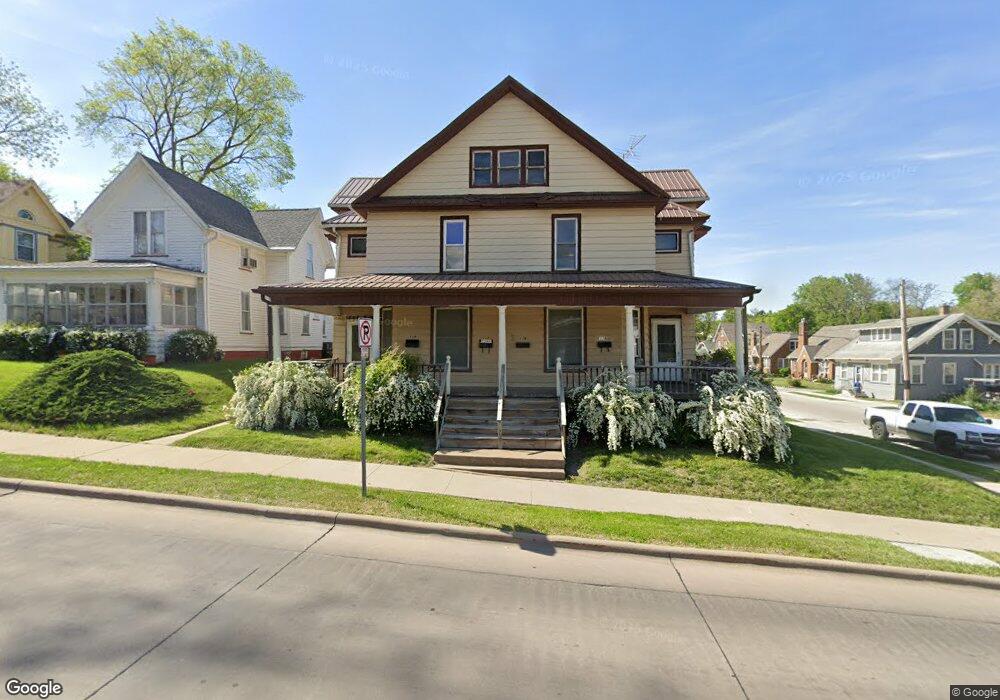
117 E 8th St Muscatine, IA 52761
Estimated Value: $138,000 - $176,000
1
Bed
4
Baths
620
Sq Ft
$251/Sq Ft
Est. Value
About This Home
4 units within this building. Two on the bottom floor and two on the top floor. Owner pays for all utilities. No smoking. One cat allowed. On-street parking.
Please email for application.
Ownership History
Date
Name
Owned For
Owner Type
Purchase Details
Closed on
Feb 15, 2017
Sold by
Orr Steve W and Orr Miriam I
Bought by
Porvenir Properties Llc
Current Estimated Value
Home Financials for this Owner
Home Financials are based on the most recent Mortgage that was taken out on this home.
Original Mortgage
$90,000
Outstanding Balance
$74,349
Interest Rate
4.12%
Mortgage Type
Future Advance Clause Open End Mortgage
Estimated Equity
$81,577
Create a Home Valuation Report for This Property
The Home Valuation Report is an in-depth analysis detailing your home's value as well as a comparison with similar homes in the area
Home Values in the Area
Average Home Value in this Area
Purchase History
| Date | Buyer | Sale Price | Title Company |
|---|---|---|---|
| Porvenir Properties Llc | $90,000 | None Available |
Source: Public Records
Mortgage History
| Date | Status | Borrower | Loan Amount |
|---|---|---|---|
| Open | Porvenir Properties Llc | $90,000 |
Source: Public Records
Property History
| Date | Event | Price | List to Sale | Price per Sq Ft |
|---|---|---|---|---|
| 10/01/2024 10/01/24 | For Rent | $650 | -- | -- |
Tax History Compared to Growth
Tax History
| Year | Tax Paid | Tax Assessment Tax Assessment Total Assessment is a certain percentage of the fair market value that is determined by local assessors to be the total taxable value of land and additions on the property. | Land | Improvement |
|---|---|---|---|---|
| 2025 | $2,556 | $143,470 | $10,860 | $132,610 |
| 2024 | $2,556 | $141,000 | $10,860 | $130,140 |
| 2023 | $2,586 | $148,570 | $10,844 | $137,726 |
| 2022 | $2,710 | $129,750 | $10,230 | $119,520 |
| 2021 | $2,710 | $112,750 | $10,230 | $102,520 |
| 2020 | $2,616 | $96,220 | $3,960 | $92,260 |
| 2019 | $3,010 | $103,420 | $0 | $0 |
| 2018 | $3,192 | $103,420 | $0 | $0 |
| 2017 | $3,192 | $112,860 | $0 | $0 |
| 2016 | $3,958 | $112,860 | $0 | $0 |
| 2015 | $3,958 | $96,830 | $0 | $0 |
| 2014 | $3,560 | $96,830 | $0 | $0 |
Source: Public Records
Map
Nearby Homes