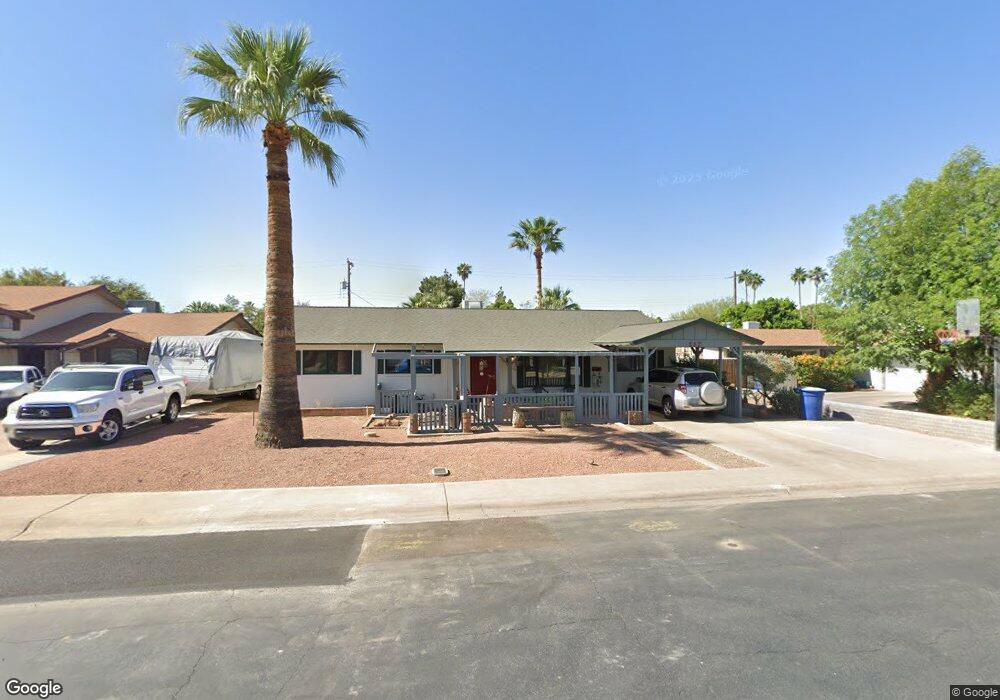
117 E La Jolla Dr Tempe, AZ 85282
Alameda NeighborhoodEstimated Value: $413,497 - $524,000
Studio
2
Baths
1,560
Sq Ft
$316/Sq Ft
Est. Value
About This Home
This home is located at 117 E La Jolla Dr, Tempe, AZ 85282 and is currently estimated at $492,374, approximately $315 per square foot. 117 E La Jolla Dr is a home located in Maricopa County with nearby schools including Carminati Elementary School, Connolly Middle School, and Tempe High School.
Ownership History
Date
Name
Owned For
Owner Type
Purchase Details
Closed on
Jul 26, 2022
Sold by
Dru Ellen Barnes Living Trust
Bought by
Gillham Corie Diane
Current Estimated Value
Purchase Details
Closed on
Jun 7, 2021
Sold by
Ellen Barnes Dru
Bought by
Dru Ellen Barnes Living Trust
Purchase Details
Closed on
Dec 28, 2004
Sold by
Boisseau Michael
Bought by
Barnes Boisseau Dru E
Home Financials for this Owner
Home Financials are based on the most recent Mortgage that was taken out on this home.
Original Mortgage
$110,500
Interest Rate
6.62%
Mortgage Type
New Conventional
Purchase Details
Closed on
Mar 6, 1995
Sold by
Ransom Duane M and Ransom Alvin J
Bought by
Barnes Barry U and Barnes Dru E
Home Financials for this Owner
Home Financials are based on the most recent Mortgage that was taken out on this home.
Original Mortgage
$92,820
Interest Rate
8.81%
Mortgage Type
VA
Create a Home Valuation Report for This Property
The Home Valuation Report is an in-depth analysis detailing your home's value as well as a comparison with similar homes in the area
Home Values in the Area
Average Home Value in this Area
Purchase History
We collect this data history from publicly available records. To have your information removed, we recommend requesting removal directly through your county’s website.
| Date | Buyer | Sale Price | Title Company |
|---|---|---|---|
| Gillham Corie Diane | -- | None Listed On Document | |
| Dru Ellen Barnes Living Trust | -- | None Listed On Document | |
| Barnes Boisseau Dru E | -- | Chicago Title Insurance Co | |
| Barnes Barry U | $91,000 | Chicago Title Insurance Co |
Source: Public Records
Mortgage History
We collect this data history from publicly available records. To have your information removed, we recommend requesting removal directly through your county’s website.
| Date | Status | Borrower | Loan Amount |
|---|---|---|---|
| Previous Owner | Barnes Boisseau Dru E | $110,500 | |
| Previous Owner | Barnes Barry U | $92,820 |
Source: Public Records
Tax History
| Year | Tax Paid | Tax Assessment Tax Assessment Total Assessment is a certain percentage of the fair market value that is determined by local assessors to be the total taxable value of land and additions on the property. | Land | Improvement |
|---|---|---|---|---|
| 2025 | $1,810 | $17,365 | -- | -- |
| 2024 | $1,661 | $16,538 | -- | -- |
| 2023 | $1,661 | $37,410 | $7,480 | $29,930 |
| 2022 | $1,586 | $28,450 | $5,690 | $22,760 |
| 2021 | $1,618 | $26,130 | $5,220 | $20,910 |
| 2020 | $1,564 | $23,870 | $4,770 | $19,100 |
| 2019 | $1,534 | $21,410 | $4,280 | $17,130 |
| 2018 | $1,493 | $19,460 | $3,890 | $15,570 |
| 2017 | $1,446 | $17,870 | $3,570 | $14,300 |
| 2016 | $1,439 | $17,080 | $3,410 | $13,670 |
| 2015 | $1,392 | $14,010 | $2,800 | $11,210 |
Source: Public Records
Map
Nearby Homes
- 206 E Manhatton Dr
- 122 E Hermosa Dr
- 3815 S Mill Ave Unit 18
- 3847 S Mill Ave Unit 26
- 224 E La Jolla Dr
- 3941 S Mill Ave Unit 39
- 14 E Hermosa Dr Unit 47
- 200 E Southern Ave Unit 136
- 200 E Southern Ave Unit 160
- 200 E Southern Ave Unit 204
- 200 E Southern Ave Unit 332
- 200 E Southern Ave Unit 224
- 200 E Southern Ave Unit 303
- 200 E Southern Ave Unit 125
- 200 E Southern Ave Unit 102
- 409 E Hermosa Cir
- 3224 S El Camino Dr
- 537 E Laguna Dr
- 410 E Southern Ave
- 4561 S Mill Ave Unit 100
- 125 E La Jolla Dr
- 111 E La Jolla Dr
- 116 E Manhatton Dr
- 131 E La Jolla Dr
- 105 E La Jolla Dr Unit 1
- 110 E Manhatton Dr
- 122 E Manhatton Dr
- 116 E La Jolla Dr
- 122 E La Jolla Dr
- 110 E La Jolla Dr
- 104 E Manhatton Dr
- 128 E Manhatton Dr
- 137 E La Jolla Dr
- 128 E La Jolla Dr
- 104 E La Jolla Dr
- 134 E La Jolla Dr
- 134 E Manhatton Dr
- 201 E La Jolla Dr
- 3808 S Grandview Ave Unit 1
- 3802 S Grandview Ave Unit 1
Your Personal Tour Guide
Ask me questions while you tour the home.