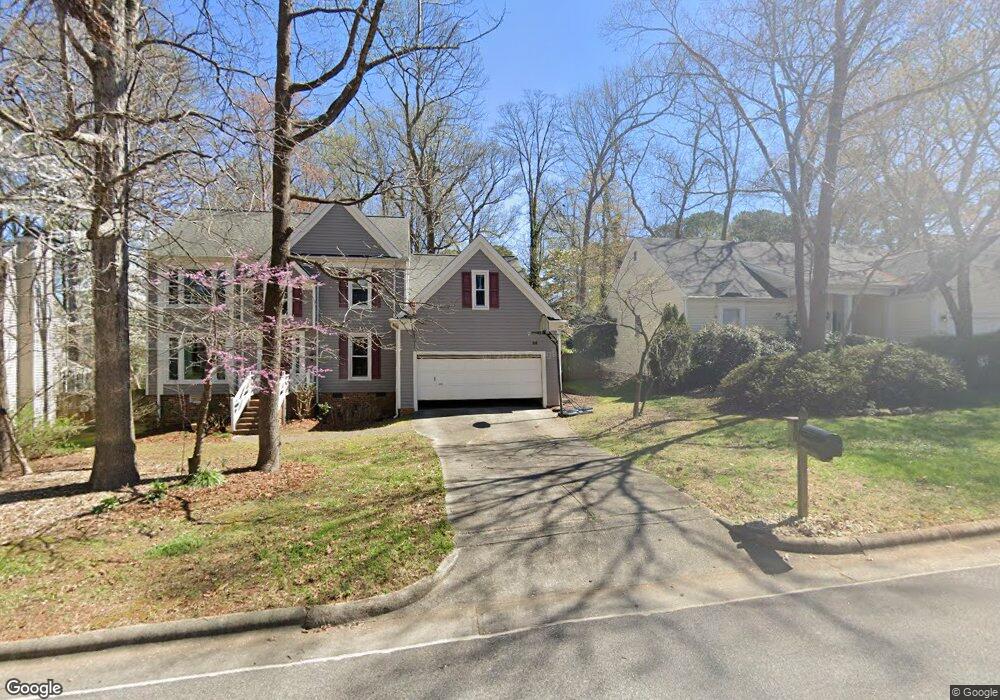
117 E Laurenbrook Ct Cary, NC 27518
Crossroads NeighborhoodEstimated Value: $556,823 - $580,000
Studio
3
Baths
2,464
Sq Ft
$229/Sq Ft
Est. Value
About This Home
This home is located at 117 E Laurenbrook Ct, Cary, NC 27518 and is currently estimated at $565,206, approximately $229 per square foot. 117 E Laurenbrook Ct is a home located in Wake County with nearby schools including Dillard Drive Magnet Elementary School, Dillard Drive Magnet Middle School, and Resurrection Lutheran School.
Ownership History
Date
Name
Owned For
Owner Type
Purchase Details
Closed on
Aug 31, 1987
Bought by
Ingle Douglas P and Ingle Linda A
Current Estimated Value
Create a Home Valuation Report for This Property
The Home Valuation Report is an in-depth analysis detailing your home's value as well as a comparison with similar homes in the area
Home Values in the Area
Average Home Value in this Area
Purchase History
| Date | Buyer | Sale Price | Title Company |
|---|---|---|---|
| Ingle Douglas P | $140,000 | -- |
Source: Public Records
Tax History
| Year | Tax Paid | Tax Assessment Tax Assessment Total Assessment is a certain percentage of the fair market value that is determined by local assessors to be the total taxable value of land and additions on the property. | Land | Improvement |
|---|---|---|---|---|
| 2025 | $4,795 | $557,061 | $175,000 | $382,061 |
| 2024 | $4,691 | $557,061 | $175,000 | $382,061 |
Source: Public Records
Map
Nearby Homes
- 300 W Kirkfield Dr
- 6315 Tryon Rd
- 0 SE Cary Pkwy Unit 2491180
- 2210 Stephens Rd
- 406 Cricketfield Ln
- 105 Headlands Ln
- 1641 Kildonan Place
- 117 Old Bridge Ln
- 117 Fox Briar Ln
- 107 Tower Hamlet Dr
- 1331 Kingston Ridge Rd
- 117 Crilly Ln
- 218 Longbridge Dr
- 117 Longbridge Dr
- 107 Larkwood Ln
- 4052 Yellowfield Way
- 4009 Yellowfield Way
- 1227 Kingston Ridge Rd
- 101 Springbrook Place
- 106 Brannigan Place
- 115 E Laurenbrook Ct
- 119 E Laurenbrook Ct
- 113 E Laurenbrook Ct
- 121 E Laurenbrook Ct
- 112 E Laurenbrook Ct
- 111 E Laurenbrook Ct
- 114 E Laurenbrook Ct
- 123 E Laurenbrook Ct
- 110 E Laurenbrook Ct
- 104 E Laurenbrook Ct
- 2608 Pink Acres St
- 108 Durington Place
- 110 Durington Place
- 2604 Pink Acres St
- 109 E Laurenbrook Ct
- 2600 Pink Acres St
- 108 E Laurenbrook Ct
- 106 E Laurenbrook Ct
- 106 Durington Place
- 105 Woodruff Ct
Your Personal Tour Guide
Ask me questions while you tour the home.