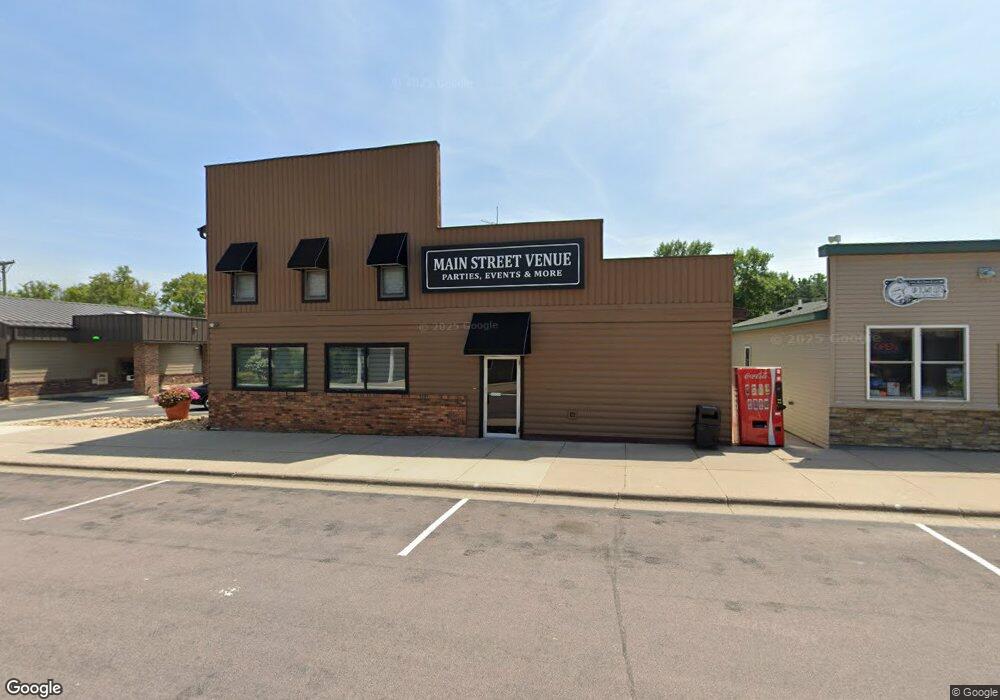
117 E Main St Elysian, MN 56028
Estimated Value: $248,000
Studio
--
Bath
7,304
Sq Ft
$34/Sq Ft
Est. Value
About This Home
This home is located at 117 E Main St, Elysian, MN 56028 and is currently priced at $248,000, approximately $33 per square foot. 117 E Main St is a home located in Le Sueur County with nearby schools including Waterville Elementary School, Morristown Elementary School, and Waterville-Elysian-Morristown Junior High School.
Ownership History
Date
Name
Owned For
Owner Type
Purchase Details
Closed on
Dec 10, 2019
Sold by
James Megan and James Nicholas
Bought by
Megan Lynch & N S James Ret
Current Estimated Value
Purchase Details
Closed on
Jul 24, 2013
Sold by
Elysian Bank
Bought by
Nu Horizons Holdings Llc
Home Financials for this Owner
Home Financials are based on the most recent Mortgage that was taken out on this home.
Original Mortgage
$50,000
Interest Rate
4.49%
Mortgage Type
Commercial
Purchase Details
Closed on
Jul 23, 2013
Sold by
Elysian Bank
Bought by
Hering Tasha M
Home Financials for this Owner
Home Financials are based on the most recent Mortgage that was taken out on this home.
Original Mortgage
$50,000
Interest Rate
4.49%
Mortgage Type
Commercial
Create a Home Valuation Report for This Property
The Home Valuation Report is an in-depth analysis detailing your home's value as well as a comparison with similar homes in the area
Purchase History
| Date | Buyer | Sale Price | Title Company |
|---|---|---|---|
| Megan Lynch & N S James Ret | -- | None Available | |
| James Megan | -- | None Available | |
| Nu Horizons Holdings Llc | -- | -- | |
| Nu Horisons Holdings Llc | $60,000 | -- | |
| Hering Tasha M | -- | -- |
Source: Public Records
Mortgage History
| Date | Status | Borrower | Loan Amount |
|---|---|---|---|
| Previous Owner | Nu Horizons Holdings Llc | $50,000 | |
| Previous Owner | Nu Horizons Holdings Llc | $45,000 | |
| Closed | Nu Horisons Holdings Llc | -- |
Source: Public Records
Tax History
| Year | Tax Paid | Tax Assessment Tax Assessment Total Assessment is a certain percentage of the fair market value that is determined by local assessors to be the total taxable value of land and additions on the property. | Land | Improvement |
|---|---|---|---|---|
| 2025 | $3,698 | $205,500 | $31,600 | $173,900 |
| 2024 | $3,250 | $193,700 | $26,600 | $167,100 |
| 2023 | $2,804 | $178,400 | $26,600 | $151,800 |
| 2022 | $2,252 | $150,200 | $23,600 | $126,600 |
| 2021 | $2,312 | $113,600 | $23,600 | $90,000 |
| 2020 | $2,320 | $113,600 | $23,600 | $90,000 |
| 2019 | $2,380 | $113,600 | $23,600 | $90,000 |
| 2018 | $2,320 | $113,600 | $23,600 | $90,000 |
| 2017 | $2,038 | $113,600 | $23,600 | $90,000 |
| 2016 | $1,482 | $113,600 | $23,600 | $90,000 |
| 2015 | $1,422 | $76,100 | $23,300 | $52,800 |
| 2014 | $1,306 | $76,100 | $23,300 | $52,800 |
| 2013 | $1,763 | $76,100 | $23,300 | $52,800 |
Source: Public Records
Map
Nearby Homes
- -XX Jason Dr
- 220 SW Maple Ave
- xx Lewis Ln
- 0 SW Maple Ave
- xxxxxx Lewis Ln
- 0 Xx Lewis Ln Unit 7025397
- 0 Xx Lewis Ln Unit 7025381
- 13 Egret Ln
- 101 Shoreview Dr
- 121 Willow Point Dr
- 125 Willow Point Dr
- 2 Marie Cir
- 3271 425th Ave
- 49279 Sportsmans Ln
- 49189 Sportsmans Ln
- 48901 N Shore Rd
- 48937 N Shore Rd
- 0 N Shore Rd
- 16965 Dickenson Ln
- 624 Tetonka View Dr
- 115 E Main St
- 128 E Main St
- 109 E Main St Unit Bldg. B
- 109 E Main St
- 109 E Main St Unit Bldg. C
- 109 E Main St Unit C
- 109 E Main St Unit B
- 109 E Main St
- 107 Main St W
- 130 E Main St
- 132 E Main St
- 107 Main St E
- 105 E Main St
- 23136 Greenland Hills Ln
- 108 E Main St
- 205 Main St E
- 205 205 E Main St
- 101 E Main St
- 105 NE 2nd St
- 102 2nd St NE
Your Personal Tour Guide
Ask me questions while you tour the home.