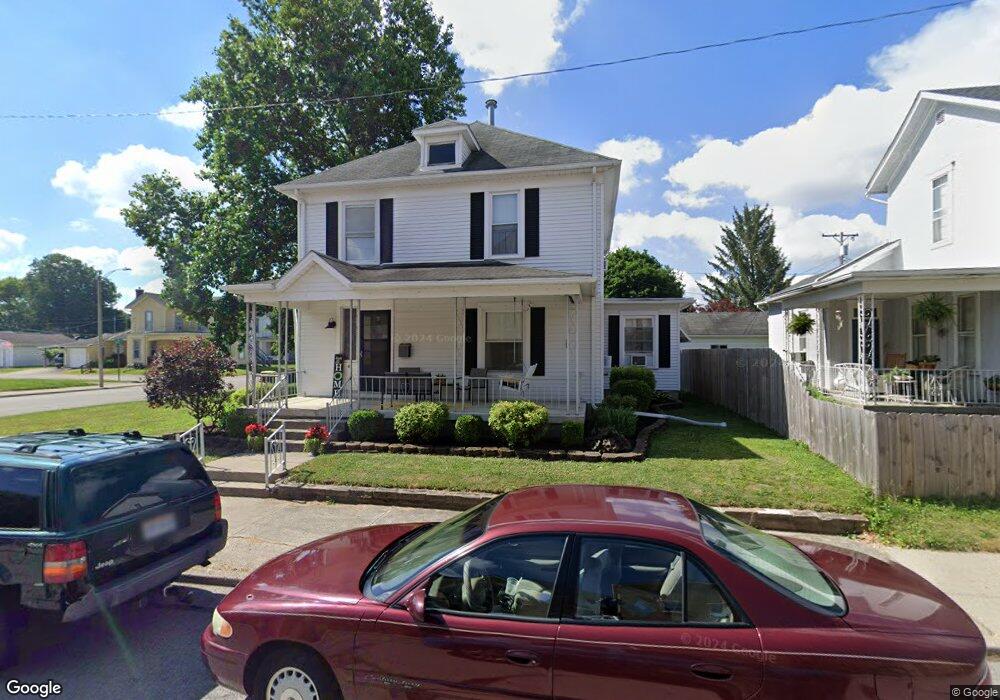
117 E Wright St Covington, OH 45318
Estimated Value: $229,000 - $237,000
4
Beds
1
Bath
1,886
Sq Ft
$124/Sq Ft
Est. Value
About This Home
This home is located at 117 E Wright St, Covington, OH 45318 and is currently estimated at $234,224, approximately $124 per square foot. 117 E Wright St is a home located in Miami County with nearby schools including Covington Elementary/Junior High School, Covington Junior High School, and Covington High School.
Ownership History
Date
Name
Owned For
Owner Type
Purchase Details
Closed on
Jul 13, 2020
Sold by
Turner Holly L and Rohr Holly L
Bought by
Wolfe Jearold R and Wolfe Melissa D
Current Estimated Value
Home Financials for this Owner
Home Financials are based on the most recent Mortgage that was taken out on this home.
Original Mortgage
$146,464
Outstanding Balance
$128,417
Interest Rate
3.1%
Mortgage Type
New Conventional
Estimated Equity
$105,807
Purchase Details
Closed on
Feb 19, 2016
Sold by
Rohr Sean R and Gephart Holly L
Bought by
Rohr Holly L
Purchase Details
Closed on
Feb 6, 2007
Sold by
Church Of The Brethren Of The Covington
Bought by
Rohr Sean R and Gephart Holly L
Home Financials for this Owner
Home Financials are based on the most recent Mortgage that was taken out on this home.
Original Mortgage
$114,900
Interest Rate
6.19%
Mortgage Type
New Conventional
Purchase Details
Closed on
Jan 1, 1990
Bought by
Brethren Ch Of Cov
Create a Home Valuation Report for This Property
The Home Valuation Report is an in-depth analysis detailing your home's value as well as a comparison with similar homes in the area
Home Values in the Area
Average Home Value in this Area
Purchase History
| Date | Buyer | Sale Price | Title Company |
|---|---|---|---|
| Wolfe Jearold R | $145,000 | None Available | |
| Rohr Holly L | -- | Attorney | |
| Rohr Sean R | $114,900 | -- | |
| Brethren Ch Of Cov | -- | -- |
Source: Public Records
Mortgage History
| Date | Status | Borrower | Loan Amount |
|---|---|---|---|
| Open | Wolfe Jearold R | $146,464 | |
| Previous Owner | Rohr Sean R | $114,900 |
Source: Public Records
Tax History
| Year | Tax Paid | Tax Assessment Tax Assessment Total Assessment is a certain percentage of the fair market value that is determined by local assessors to be the total taxable value of land and additions on the property. | Land | Improvement |
|---|---|---|---|---|
| 2025 | $2,460 | $75,360 | $10,220 | $65,140 |
| 2024 | $2,460 | $59,230 | $11,100 | $48,130 |
| 2023 | $2,218 | $59,230 | $11,100 | $48,130 |
| 2022 | $2,213 | $59,230 | $11,100 | $48,130 |
| 2021 | $1,838 | $45,570 | $8,540 | $37,030 |
| 2020 | $1,842 | $45,570 | $8,540 | $37,030 |
| 2019 | $1,850 | $45,570 | $8,540 | $37,030 |
| 2018 | $1,691 | $41,550 | $6,650 | $34,900 |
| 2017 | $1,721 | $41,550 | $6,650 | $34,900 |
| 2016 | $1,699 | $41,550 | $6,650 | $34,900 |
| 2015 | $1,566 | $39,980 | $6,410 | $33,570 |
| 2014 | $1,566 | $39,980 | $6,410 | $33,570 |
| 2013 | $1,508 | $39,980 | $6,410 | $33,570 |
Source: Public Records
Map
Nearby Homes
Your Personal Tour Guide
Ask me questions while you tour the home.