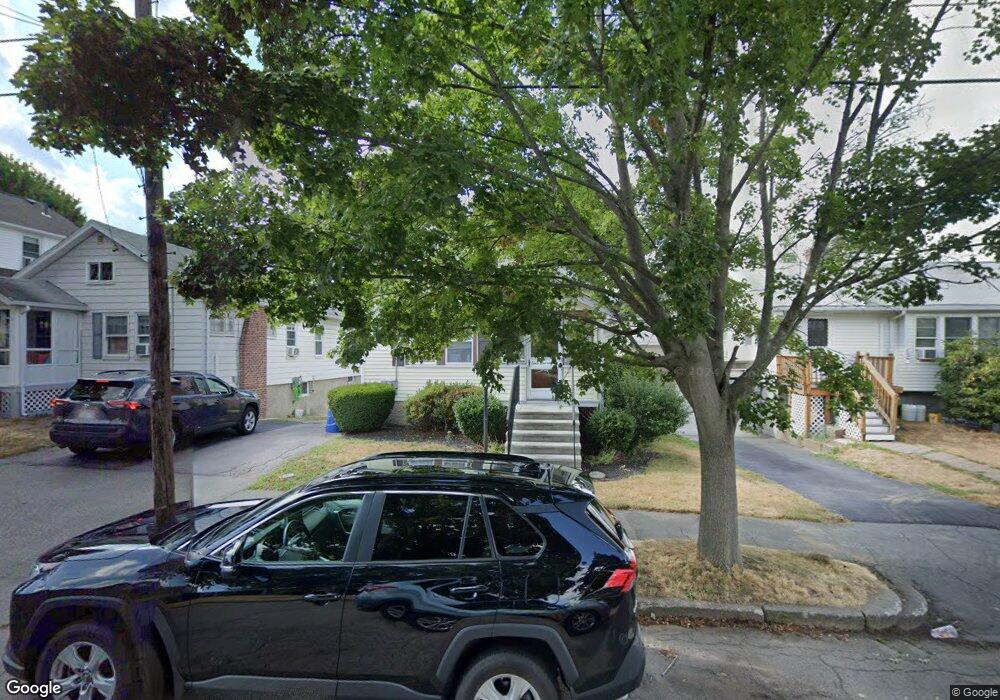
117 Elliot Ave Quincy, MA 02171
Montclair NeighborhoodEstimated Value: $542,329 - $632,000
2
Beds
1
Bath
800
Sq Ft
$733/Sq Ft
Est. Value
About This Home
This home is located at 117 Elliot Ave, Quincy, MA 02171 and is currently estimated at $586,582, approximately $733 per square foot. 117 Elliot Ave is a home located in Norfolk County with nearby schools including Montclair Elementary School, Atlantic Middle School, and North Quincy High School.
Ownership History
Date
Name
Owned For
Owner Type
Purchase Details
Closed on
Jun 8, 2007
Sold by
Buckley Margaret M and Perez Margaret M
Bought by
Perez Elizabeth M
Current Estimated Value
Home Financials for this Owner
Home Financials are based on the most recent Mortgage that was taken out on this home.
Original Mortgage
$195,000
Outstanding Balance
$119,190
Interest Rate
6.17%
Mortgage Type
Purchase Money Mortgage
Estimated Equity
$467,392
Create a Home Valuation Report for This Property
The Home Valuation Report is an in-depth analysis detailing your home's value as well as a comparison with similar homes in the area
Home Values in the Area
Average Home Value in this Area
Purchase History
| Date | Buyer | Sale Price | Title Company |
|---|---|---|---|
| Perez Elizabeth M | $282,000 | -- |
Source: Public Records
Mortgage History
| Date | Status | Borrower | Loan Amount |
|---|---|---|---|
| Open | Perez Elizabeth M | $195,000 |
Source: Public Records
Tax History
| Year | Tax Paid | Tax Assessment Tax Assessment Total Assessment is a certain percentage of the fair market value that is determined by local assessors to be the total taxable value of land and additions on the property. | Land | Improvement |
|---|---|---|---|---|
| 2025 | $5,782 | $501,500 | $325,100 | $176,400 |
| 2024 | $5,585 | $495,600 | $325,100 | $170,500 |
| 2023 | $5,362 | $481,800 | $309,600 | $172,200 |
| 2022 | $5,132 | $428,400 | $269,200 | $159,200 |
| 2021 | $4,932 | $406,300 | $256,400 | $149,900 |
| 2020 | $4,771 | $383,800 | $256,400 | $127,400 |
| 2019 | $4,505 | $359,000 | $239,700 | $119,300 |
| 2018 | $4,434 | $332,400 | $221,900 | $110,500 |
| 2017 | $4,377 | $308,900 | $211,300 | $97,600 |
| 2016 | $3,988 | $277,700 | $183,800 | $93,900 |
| 2015 | $3,673 | $251,600 | $167,100 | $84,500 |
| 2014 | $3,483 | $234,400 | $159,100 | $75,300 |
Source: Public Records
Map
Nearby Homes
- 253 W Squantum St
- 52 Hamilton Ave
- 43 Hilma St
- 98 Safford St
- 154 N Central Ave
- 39 Fayette St Unit 403
- 123 Piermont St
- 0 Franklin St
- 17 Holmes St Unit 2
- 17 Holmes St Unit 3
- 406 Beale St
- 52 California Ave
- 10 Weston Ave Unit 322
- 70 Walnut St
- 440 Granite Ave Unit 201
- 41 Wallace Rd
- 85 E Squantum St Unit 10
- 400 Adams St Unit A
- 397 Adams St
- 10 White St
- 121 Elliot Ave
- 39 Bowdoin St
- 35 Bowdoin St
- 125 Elliot Ave
- 31 Bowdoin St
- 212 Holbrook Rd
- 127 Elliot Ave
- 208 Holbrook Rd
- 216 Holbrook Rd
- 114 Elliot Ave
- 204 Holbrook Rd
- 40 Bowdoin St
- 120 Elliot Ave
- 220 Holbrook Rd
- 131 Elliot Ave
- 126 Elliot Ave
- 106 Elliot Ave
- 196 Holbrook Rd
- 196 Holbrook Rd Unit 2
- 53 Bowdoin St