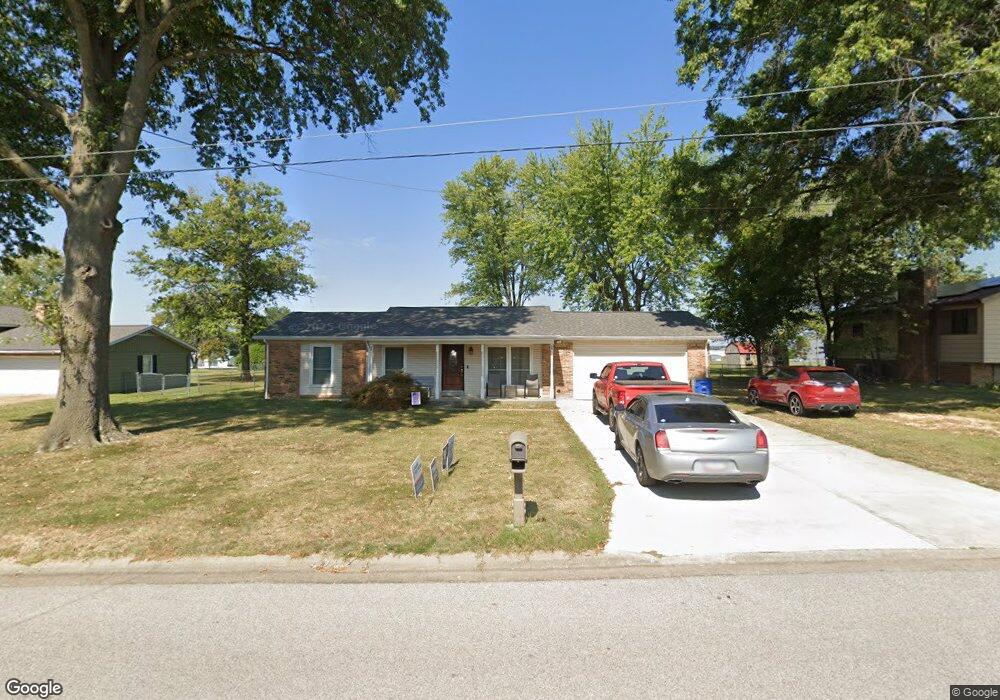
117 Fox Run Sparta, IL 62286
Estimated Value: $209,689 - $260,000
Studio
--
Bath
--
Sq Ft
21,344
Sq Ft Lot
About This Home
This home is located at 117 Fox Run, Sparta, IL 62286 and is currently estimated at $242,172. 117 Fox Run is a home located in Randolph County with nearby schools including Sparta High School.
Ownership History
Date
Name
Owned For
Owner Type
Purchase Details
Closed on
Dec 11, 2020
Sold by
Beckley Jordan and Beckley Brittany R
Bought by
Springs Jason and Springs Mindy
Current Estimated Value
Home Financials for this Owner
Home Financials are based on the most recent Mortgage that was taken out on this home.
Original Mortgage
$144,000
Outstanding Balance
$128,318
Interest Rate
2.75%
Mortgage Type
New Conventional
Estimated Equity
$113,854
Purchase Details
Closed on
Feb 25, 2017
Sold by
Dickerson Peggy K and Dickerson Barry A
Bought by
Woods Brittany R
Home Financials for this Owner
Home Financials are based on the most recent Mortgage that was taken out on this home.
Original Mortgage
$159,080
Interest Rate
4.13%
Mortgage Type
New Conventional
Create a Home Valuation Report for This Property
The Home Valuation Report is an in-depth analysis detailing your home's value as well as a comparison with similar homes in the area
Home Values in the Area
Average Home Value in this Area
Purchase History
| Date | Buyer | Sale Price | Title Company |
|---|---|---|---|
| Springs Jason | $180,000 | None Available | |
| Woods Brittany R | $164,000 | -- |
Source: Public Records
Mortgage History
| Date | Status | Borrower | Loan Amount |
|---|---|---|---|
| Open | Springs Jason | $144,000 | |
| Previous Owner | Woods Brittany R | $159,080 |
Source: Public Records
Tax History
| Year | Tax Paid | Tax Assessment Tax Assessment Total Assessment is a certain percentage of the fair market value that is determined by local assessors to be the total taxable value of land and additions on the property. | Land | Improvement |
|---|---|---|---|---|
| 2024 | $5,040 | $59,130 | $7,490 | $51,640 |
| 2022 | $4,278 | $56,040 | $3,820 | $52,220 |
| 2021 | $4,447 | $52,880 | $3,605 | $49,275 |
| 2020 | $4,191 | $54,152 | $3,689 | $50,463 |
| 2019 | $4,087 | $48,465 | $3,300 | $45,165 |
| 2018 | $4,055 | $53,432 | $3,638 | $49,794 |
| 2017 | $2,554 | $37,735 | $3,330 | $34,405 |
| 2016 | $2,677 | $36,365 | $3,210 | $33,155 |
| 2015 | $2,662 | $36,365 | $3,210 | $33,155 |
| 2014 | $2,662 | $37,080 | $3,275 | $33,805 |
| 2013 | $2,540 | $37,550 | $3,315 | $34,235 |
Source: Public Records
Map
Nearby Homes
- 1120 N Market St
- 1005 N James St
- 151 Doc Lin Dr
- 1007 Hillcrest Dr
- 710 N Maple St
- 501 N Market St
- 310 E Mound St
- 316 N St Louis St
- 409 E Mound St
- 305 N James St
- 408 E Mound St
- 220 N Vine St
- 702 E Feifer St
- 714 E Feifer St
- 712 E Harrison St
- 105 S Washington
- 109 S Washington St
- 1019 E Main St
- 510 E Main St
- 540 E Broadway St
Your Personal Tour Guide
Ask me questions while you tour the home.