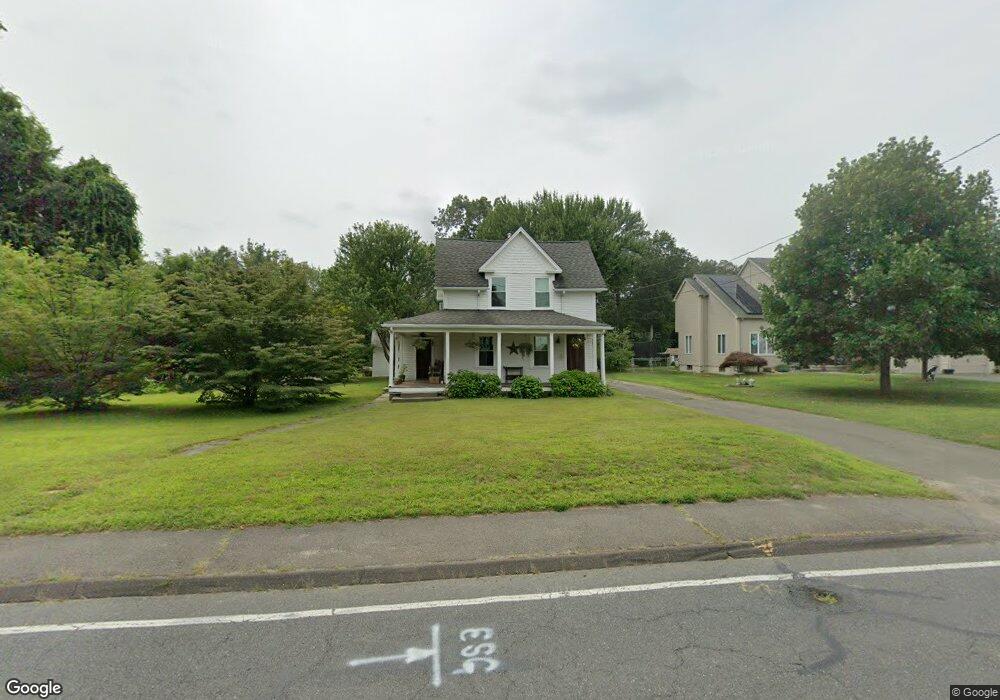
117 Fuller St Ludlow, MA 01056
Estimated Value: $282,899 - $349,000
2
Beds
1
Bath
1,145
Sq Ft
$271/Sq Ft
Est. Value
About This Home
This home is located at 117 Fuller St, Ludlow, MA 01056 and is currently estimated at $310,225, approximately $270 per square foot. 117 Fuller St is a home located in Hampden County with nearby schools including East Street Elementary School, Chapin Street Elementary School, and Paul R. Baird Middle School.
Ownership History
Date
Name
Owned For
Owner Type
Purchase Details
Closed on
Sep 4, 2019
Sold by
Hebb Jessica
Bought by
Ottani Mark E
Current Estimated Value
Home Financials for this Owner
Home Financials are based on the most recent Mortgage that was taken out on this home.
Original Mortgage
$92,000
Outstanding Balance
$79,876
Interest Rate
3.6%
Mortgage Type
New Conventional
Estimated Equity
$230,349
Purchase Details
Closed on
Dec 1, 2006
Sold by
Devlin Jada A
Bought by
Bousquet Jessica
Purchase Details
Closed on
Feb 11, 2002
Sold by
Nowak Henry L and Nowak Hildregard
Bought by
Ottani Judith A
Purchase Details
Closed on
Jan 31, 1996
Sold by
Pereira Norbert A and Pereira Nicole
Bought by
Riopelle Laura J
Create a Home Valuation Report for This Property
The Home Valuation Report is an in-depth analysis detailing your home's value as well as a comparison with similar homes in the area
Home Values in the Area
Average Home Value in this Area
Purchase History
| Date | Buyer | Sale Price | Title Company |
|---|---|---|---|
| Ottani Mark E | -- | -- | |
| Ottani Mark E | -- | -- | |
| Bousquet Jessica | $53,000 | -- | |
| Bousquet Jessica | $53,000 | -- | |
| Bousquet Jessica | $53,000 | -- | |
| Ottani Judith A | $92,000 | -- | |
| Ottani Judith A | $92,000 | -- | |
| Riopelle Laura J | $111,000 | -- | |
| Riopelle Laura J | $111,000 | -- |
Source: Public Records
Mortgage History
| Date | Status | Borrower | Loan Amount |
|---|---|---|---|
| Open | Ottani Mark E | $92,000 | |
| Closed | Ottani Mark E | $92,000 | |
| Previous Owner | Riopelle Laura J | $50,000 | |
| Previous Owner | Riopelle Laura J | $27,500 |
Source: Public Records
Tax History
| Year | Tax Paid | Tax Assessment Tax Assessment Total Assessment is a certain percentage of the fair market value that is determined by local assessors to be the total taxable value of land and additions on the property. | Land | Improvement |
|---|---|---|---|---|
| 2025 | $3,656 | $210,700 | $82,700 | $128,000 |
| 2024 | $3,576 | $197,700 | $83,900 | $113,800 |
| 2023 | $3,375 | $173,000 | $73,700 | $99,300 |
| 2022 | $3,250 | $162,600 | $73,700 | $88,900 |
| 2021 | $3,288 | $156,000 | $73,700 | $82,300 |
| 2020 | $3,151 | $152,800 | $72,500 | $80,300 |
| 2019 | $2,941 | $148,400 | $71,900 | $76,500 |
| 2018 | $2,768 | $145,600 | $71,900 | $73,700 |
| 2017 | $2,659 | $143,500 | $70,400 | $73,100 |
| 2016 | $2,527 | $139,400 | $69,000 | $70,400 |
| 2015 | $2,374 | $137,300 | $68,300 | $69,000 |
Source: Public Records
Map
Nearby Homes
- 119 Blisswood Village Dr
- 98 Fuller St Unit 32
- 70 Fuller St
- 42 Loopley St
- 102 Swan Ave
- 0 Fuller St Unit 73409741
- 26 Swan Ave
- 57 Belmont St
- 350 West Ave Unit 5
- Lot 602 Grandview Ave
- 84 Chapin Greene Dr
- 39 Rogers Ave
- 14 Arthur St
- 382 Holyoke St
- 162 Highland Ave
- 47 Kendall St
- 0 Center St Unit 73415933
- 31 Greenwich St
- 70 Sroka Ln
- 59 Prospect St
- 121 Fuller St
- 111 Fuller St
- 125 Fuller St
- 127 Fuller St
- 220 Blisswood Village Dr
- 219 Blisswood Village Dr
- 218 Blisswood Village Dr
- 217 Blisswood Village Dr
- 216 Blisswood Village Dr
- 215 Blisswood Village Dr
- 214 Blisswood Village Dr
- 213 Blisswood Village Dr
- 212 Blisswood Village Dr
- 211 Blisswood Village Dr
- 210 Blisswood Village Dr
- 209 Blisswood Village Dr
- 208 Blisswood Village Dr
- 207 Blisswood Village Dr
- 206 Blisswood Village Dr
- 205 Blisswood Village Dr
Your Personal Tour Guide
Ask me questions while you tour the home.