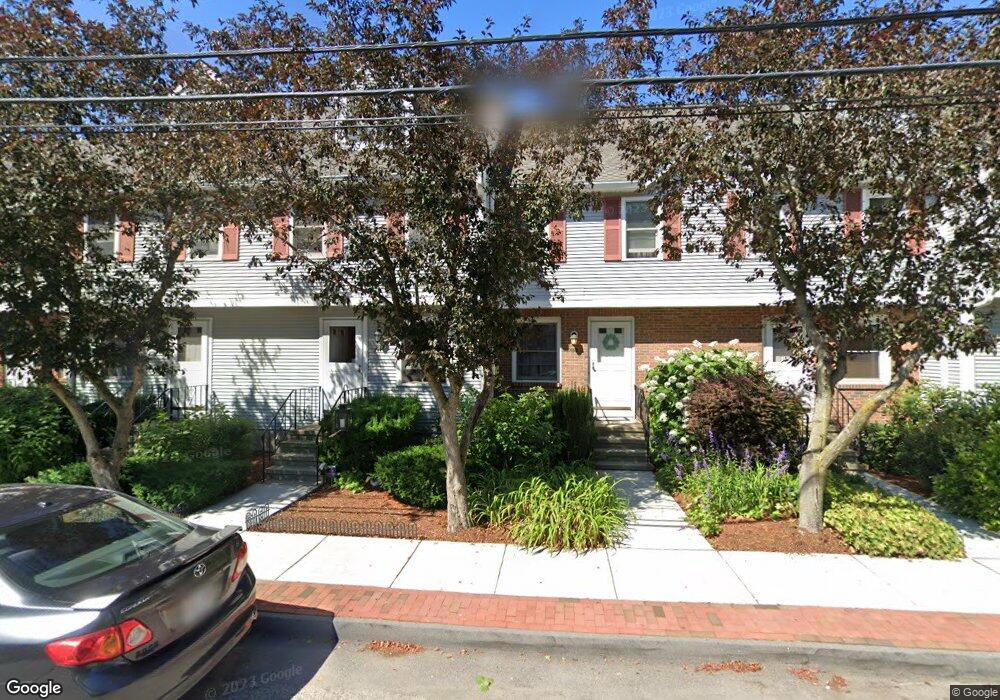
117 Grew Ave Unit A Roslindale, MA 02131
Roslindale NeighborhoodEstimated Value: $469,000 - $497,000
2
Beds
2
Baths
1,050
Sq Ft
$463/Sq Ft
Est. Value
About This Home
This home is located at 117 Grew Ave Unit A, Roslindale, MA 02131 and is currently estimated at $486,054, approximately $462 per square foot. 117 Grew Ave Unit A is a home located in Suffolk County with nearby schools including Brooke Charter School Roslindale, Sacred Heart STEM School, and St. Clare High School.
Ownership History
Date
Name
Owned For
Owner Type
Purchase Details
Closed on
Apr 11, 2011
Sold by
Mortgage It Inc
Bought by
Berkshire Investments
Current Estimated Value
Home Financials for this Owner
Home Financials are based on the most recent Mortgage that was taken out on this home.
Original Mortgage
$100,000
Outstanding Balance
$69,601
Interest Rate
4.99%
Mortgage Type
Purchase Money Mortgage
Estimated Equity
$416,453
Purchase Details
Closed on
Jan 13, 2011
Sold by
Rivera Kenneth and Rivera Mortgageit
Bought by
Mortgageit
Purchase Details
Closed on
May 15, 2008
Sold by
Rivera Kenneth and Gmac Mortgage Llc
Bought by
Gmac Mortgage Llc
Purchase Details
Closed on
Dec 6, 2004
Sold by
Tannous Christine and Tannous Laurie Y
Bought by
Rivera Kenneth
Purchase Details
Closed on
Dec 1, 2000
Sold by
Nova Juan P
Bought by
Tannous Christine
Purchase Details
Closed on
Jan 30, 1997
Sold by
Pena Juan F and Francisco Marisol
Bought by
Nova Juan P
Create a Home Valuation Report for This Property
The Home Valuation Report is an in-depth analysis detailing your home's value as well as a comparison with similar homes in the area
Home Values in the Area
Average Home Value in this Area
Purchase History
| Date | Buyer | Sale Price | Title Company |
|---|---|---|---|
| Berkshire Investments | $114,900 | -- | |
| Berkshire Investments | $114,900 | -- | |
| Mortgageit | $162,000 | -- | |
| Mortgageit | $162,000 | -- | |
| Gmac Mortgage Llc | $193,500 | -- | |
| Gmac Mortgage Llc | $193,500 | -- | |
| Rivera Kenneth | $299,000 | -- | |
| Rivera Kenneth | $299,000 | -- | |
| Tannous Christine | $170,000 | -- | |
| Nova Juan P | $107,000 | -- |
Source: Public Records
Mortgage History
| Date | Status | Borrower | Loan Amount |
|---|---|---|---|
| Open | Berkshire Investments | $100,000 | |
| Closed | Nova Juan P | $100,000 |
Source: Public Records
Tax History Compared to Growth
Tax History
| Year | Tax Paid | Tax Assessment Tax Assessment Total Assessment is a certain percentage of the fair market value that is determined by local assessors to be the total taxable value of land and additions on the property. | Land | Improvement |
|---|---|---|---|---|
| 2025 | $4,752 | $410,400 | $0 | $410,400 |
| 2024 | $3,574 | $327,900 | $0 | $327,900 |
| 2023 | $3,352 | $312,100 | $0 | $312,100 |
| 2022 | $3,174 | $291,700 | $0 | $291,700 |
| 2021 | $2,909 | $272,600 | $0 | $272,600 |
| 2020 | $2,853 | $270,200 | $0 | $270,200 |
| 2019 | $2,712 | $257,300 | $0 | $257,300 |
| 2018 | $2,697 | $257,300 | $0 | $257,300 |
| 2017 | $2,725 | $257,300 | $0 | $257,300 |
| 2016 | $2,573 | $233,900 | $0 | $233,900 |
| 2015 | $2,673 | $220,700 | $0 | $220,700 |
| 2014 | $2,593 | $206,100 | $0 | $206,100 |
Source: Public Records
Map
Nearby Homes
- 42 Doncaster St
- 2 Pinedale Rd Unit 3
- 87 Clare Ave
- 650 Hyde Park Ave Unit 2
- 175 Clare Ave Unit B2
- 175 Clare Ave Unit B7
- 175 Clare Ave Unit B4
- 16 Hilburn Place
- 42 Wilmot St
- 4 Rowe Ct
- 61 Whitford St
- 57 Hemman St
- 250 Poplar St Unit 1
- 75 Glendower Rd
- 895 Hyde Park Ave Unit 2
- 42 Hemman St
- 30 Macdonald St
- 89 Glendower Rd
- 15 Beechmont Terrace
- 514 Metropolitan Ave Unit 1
- 117 Grew Ave Unit B
- 117 Grew Ave Unit 117-A
- 117 Grew Ave Unit 117A 111-A
- 115 Grew Ave Unit B
- 115 Grew Ave Unit A
- 115 Grew Ave Unit 115B
- 113 Grew Ave Unit B
- 113 Grew Ave Unit A
- 113 Grew Ave Unit 113B
- 113 Grew Ave Unit 113A
- 111 Grew Ave Unit B
- 111 Grew Ave Unit A
- 111 Grew Ave Unit 111b
- 77 Grew Ave Unit A
- 75 Grew Ave Unit B
- 75 Grew Ave Unit A
- 77 Grew Ave Unit B
- 77 B Grew Ave Unit 77B
- 73 Grew Ave Unit B
- 73 Grew Ave Unit A