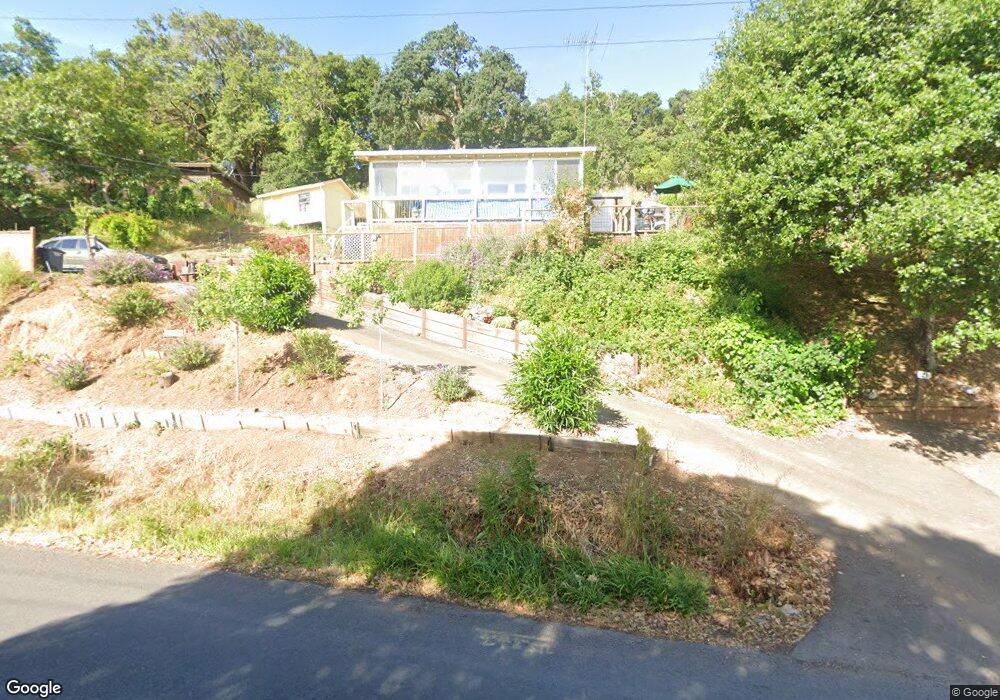
117 Harbor Dr Novato, CA 94945
Black Point NeighborhoodEstimated Value: $503,544 - $972,000
1
Bed
1
Bath
504
Sq Ft
$1,329/Sq Ft
Est. Value
About This Home
This home is located at 117 Harbor Dr, Novato, CA 94945 and is currently estimated at $669,636, approximately $1,328 per square foot. 117 Harbor Dr is a home located in Marin County with nearby schools including Sinaloa Middle School, San Marin High School, and Good Shepherd Lutheran School.
Ownership History
Date
Name
Owned For
Owner Type
Purchase Details
Closed on
Jul 22, 2019
Sold by
Angalde Mary Joan and Mary Joan Angalde Revocable Li
Bought by
Anglade Mary Joan and Mary Joan Anglade Revocable Li
Current Estimated Value
Home Financials for this Owner
Home Financials are based on the most recent Mortgage that was taken out on this home.
Original Mortgage
$450,000
Outstanding Balance
$394,240
Interest Rate
3.82%
Mortgage Type
Commercial
Estimated Equity
$275,396
Purchase Details
Closed on
Mar 23, 2001
Sold by
Buttimer John J
Bought by
Anglade Mary J
Home Financials for this Owner
Home Financials are based on the most recent Mortgage that was taken out on this home.
Original Mortgage
$168,000
Interest Rate
7.06%
Mortgage Type
Seller Take Back
Purchase Details
Closed on
Jan 19, 2001
Sold by
Peer Ralph I and Peer Elizabeth
Bought by
Buttimer John J and Buttimer Jeanne
Create a Home Valuation Report for This Property
The Home Valuation Report is an in-depth analysis detailing your home's value as well as a comparison with similar homes in the area
Home Values in the Area
Average Home Value in this Area
Purchase History
| Date | Buyer | Sale Price | Title Company |
|---|---|---|---|
| Anglade Mary Joan | -- | Fidelity National Title Co | |
| Anglade Mary J | $180,000 | California Land Title | |
| Buttimer John J | -- | California Land Title |
Source: Public Records
Mortgage History
| Date | Status | Borrower | Loan Amount |
|---|---|---|---|
| Open | Anglade Mary Joan | $450,000 | |
| Closed | Anglade Mary J | $168,000 |
Source: Public Records
Tax History Compared to Growth
Tax History
| Year | Tax Paid | Tax Assessment Tax Assessment Total Assessment is a certain percentage of the fair market value that is determined by local assessors to be the total taxable value of land and additions on the property. | Land | Improvement |
|---|---|---|---|---|
| 2025 | $3,476 | $271,210 | $226,009 | $45,201 |
| 2024 | $3,476 | $265,893 | $221,578 | $44,315 |
| 2023 | $3,384 | $260,680 | $217,234 | $43,446 |
| 2022 | $3,299 | $255,571 | $212,976 | $42,595 |
| 2021 | $3,267 | $250,560 | $208,800 | $41,760 |
| 2020 | $3,235 | $247,990 | $206,659 | $41,331 |
| 2019 | $3,136 | $243,129 | $202,608 | $40,521 |
| 2018 | $3,093 | $238,363 | $198,636 | $39,727 |
| 2017 | $3,039 | $233,690 | $194,742 | $38,948 |
| 2016 | $2,820 | $229,108 | $190,924 | $38,184 |
| 2015 | $2,779 | $225,669 | $188,058 | $37,611 |
| 2014 | $2,715 | $221,250 | $184,375 | $36,875 |
Source: Public Records
Map
Nearby Homes