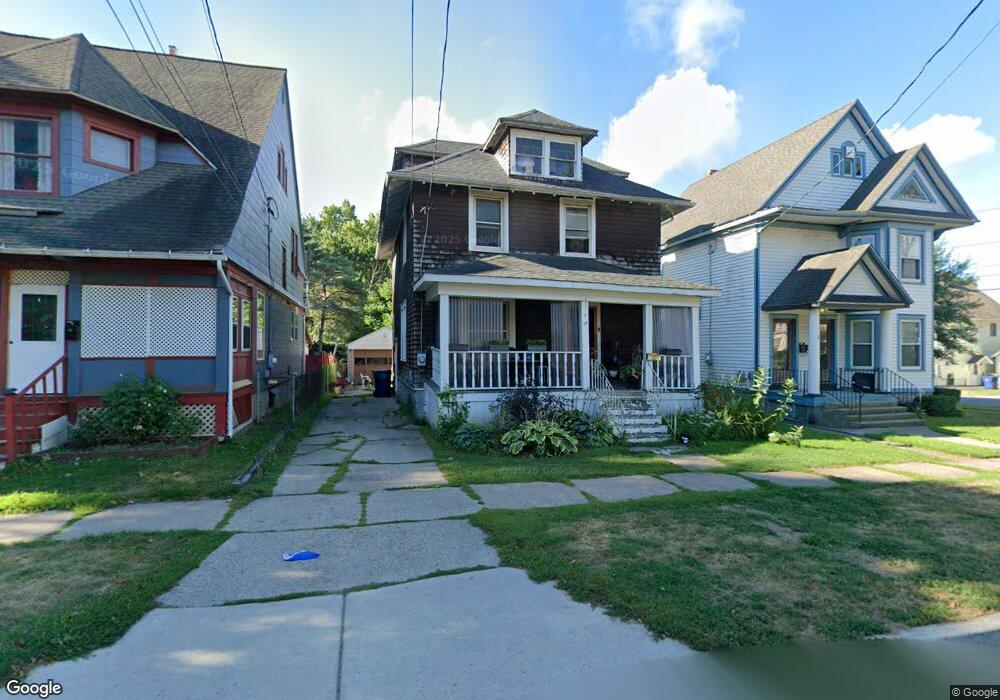
117 High St Lockport, NY 14094
Estimated Value: $142,000 - $198,000
4
Beds
2
Baths
1,920
Sq Ft
$87/Sq Ft
Est. Value
About This Home
This home is located at 117 High St, Lockport, NY 14094 and is currently estimated at $167,719, approximately $87 per square foot. 117 High St is a home located in Niagara County with nearby schools including Aaron Mossell Junior High School, Lockport High School, and DeSales Catholic School.
Ownership History
Date
Name
Owned For
Owner Type
Purchase Details
Closed on
Dec 7, 2007
Sold by
Pettitt Lisa
Bought by
Pettitt Edward
Current Estimated Value
Purchase Details
Closed on
Mar 20, 2007
Sold by
Sovereign Bank
Bought by
Pettitt Lisa
Purchase Details
Closed on
Dec 18, 2006
Sold by
Maxson Erie
Bought by
Sovereign Bank
Purchase Details
Closed on
Jun 10, 1996
Sold by
Lanham Mickey Alicia
Bought by
Maxson Erie L and Maxson Cheryl L
Purchase Details
Closed on
Nov 18, 1994
Sold by
Hood James A
Bought by
Lanham Mickey Alicia
Create a Home Valuation Report for This Property
The Home Valuation Report is an in-depth analysis detailing your home's value as well as a comparison with similar homes in the area
Home Values in the Area
Average Home Value in this Area
Purchase History
| Date | Buyer | Sale Price | Title Company |
|---|---|---|---|
| Pettitt Edward | -- | Richard May | |
| Pettitt Lisa | $36,000 | Richard May | |
| Sovereign Bank | $33,906 | Knuckles & Komosinski Pc | |
| Maxson Erie L | $63,200 | -- | |
| Lanham Mickey Alicia | $57,000 | -- |
Source: Public Records
Tax History Compared to Growth
Tax History
| Year | Tax Paid | Tax Assessment Tax Assessment Total Assessment is a certain percentage of the fair market value that is determined by local assessors to be the total taxable value of land and additions on the property. | Land | Improvement |
|---|---|---|---|---|
| 2024 | $3,853 | $126,000 | $3,200 | $122,800 |
| 2023 | $3,863 | $120,000 | $3,200 | $116,800 |
| 2022 | $2,760 | $109,000 | $3,200 | $105,800 |
| 2021 | $2,760 | $70,000 | $3,500 | $66,500 |
| 2020 | $2,701 | $70,000 | $3,500 | $66,500 |
| 2019 | $605 | $70,000 | $3,500 | $66,500 |
| 2018 | $1,953 | $70,000 | $3,500 | $66,500 |
| 2017 | $1,946 | $70,000 | $3,500 | $66,500 |
| 2016 | $1,884 | $70,000 | $3,500 | $66,500 |
| 2015 | -- | $70,000 | $3,500 | $66,500 |
| 2014 | -- | $70,000 | $3,500 | $66,500 |
Source: Public Records
Map
Nearby Homes