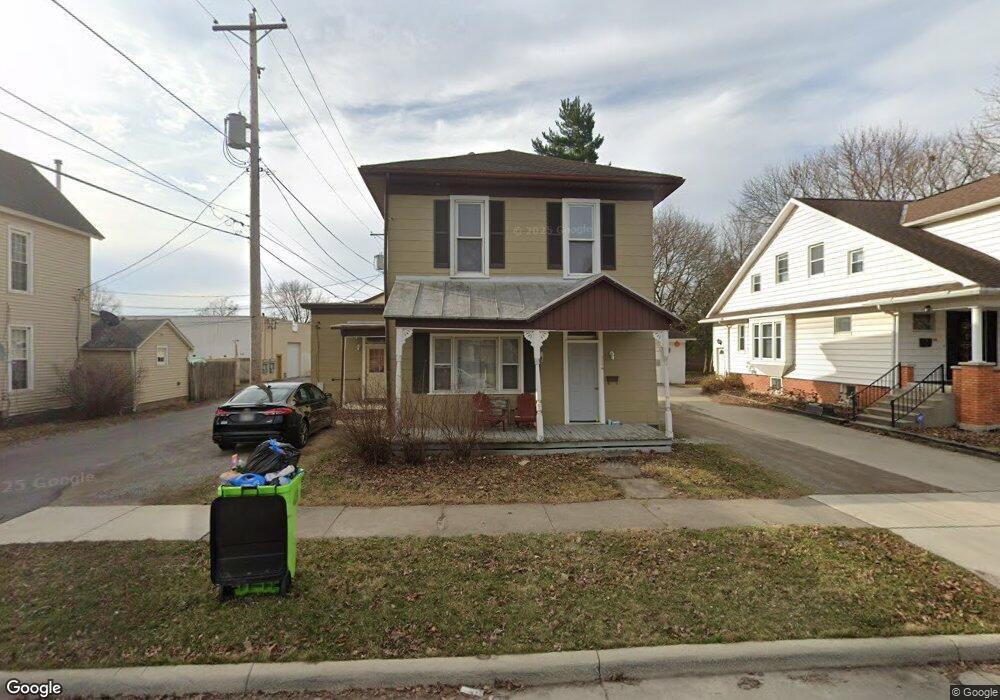
117 Howard St Findlay, OH 45840
Estimated Value: $87,654 - $138,000
3
Beds
2
Baths
1,636
Sq Ft
$75/Sq Ft
Est. Value
About This Home
This home is located at 117 Howard St, Findlay, OH 45840 and is currently estimated at $123,164, approximately $75 per square foot. 117 Howard St is a home located in Hancock County with nearby schools including Whittier Primary School, Bigelow Hill Elementary School, and Glenwood Middle School.
Ownership History
Date
Name
Owned For
Owner Type
Purchase Details
Closed on
Apr 15, 2019
Sold by
Maximus Management Llc
Bought by
Staschiak Rentals Llc
Current Estimated Value
Home Financials for this Owner
Home Financials are based on the most recent Mortgage that was taken out on this home.
Original Mortgage
$100,000
Outstanding Balance
$88,095
Interest Rate
4.4%
Mortgage Type
Commercial
Estimated Equity
$35,069
Purchase Details
Closed on
Aug 3, 1999
Sold by
Wiler Shirley
Bought by
Keirns Thomas German Ken
Home Financials for this Owner
Home Financials are based on the most recent Mortgage that was taken out on this home.
Original Mortgage
$77,600
Interest Rate
7.69%
Mortgage Type
New Conventional
Purchase Details
Closed on
Aug 6, 1986
Bought by
Wiler Merrill E and Wiler Shirley
Purchase Details
Closed on
Jul 23, 1986
Bought by
Williams Ruth M
Create a Home Valuation Report for This Property
The Home Valuation Report is an in-depth analysis detailing your home's value as well as a comparison with similar homes in the area
Home Values in the Area
Average Home Value in this Area
Purchase History
| Date | Buyer | Sale Price | Title Company |
|---|---|---|---|
| Staschiak Rentals Llc | $89,000 | Assured Title Agency | |
| Keirns Thomas German Ken | $75,000 | -- | |
| Wiler Merrill E | $30,000 | -- | |
| Williams Ruth M | -- | -- |
Source: Public Records
Mortgage History
| Date | Status | Borrower | Loan Amount |
|---|---|---|---|
| Open | Staschiak Rentals Llc | $100,000 | |
| Previous Owner | Keirns Thomas German Ken | $77,600 |
Source: Public Records
Tax History
| Year | Tax Paid | Tax Assessment Tax Assessment Total Assessment is a certain percentage of the fair market value that is determined by local assessors to be the total taxable value of land and additions on the property. | Land | Improvement |
|---|---|---|---|---|
| 2024 | $599 | $16,440 | $2,750 | $13,690 |
| 2023 | $600 | $16,440 | $2,750 | $13,690 |
| 2022 | $598 | $16,440 | $2,750 | $13,690 |
| 2021 | $675 | $16,170 | $2,760 | $13,410 |
| 2020 | $675 | $16,170 | $2,760 | $13,410 |
| 2019 | $662 | $16,170 | $2,760 | $13,410 |
| 2018 | $1,081 | $24,230 | $2,400 | $21,830 |
| 2017 | $541 | $24,230 | $2,400 | $21,830 |
| 2016 | $3,312 | $21,060 | $2,400 | $18,660 |
| 2015 | $947 | $21,060 | $2,400 | $18,660 |
| 2014 | $947 | $21,060 | $2,400 | $18,660 |
| 2012 | $787 | $17,340 | $2,400 | $14,940 |
Source: Public Records
Map
Nearby Homes
Your Personal Tour Guide
Ask me questions while you tour the home.