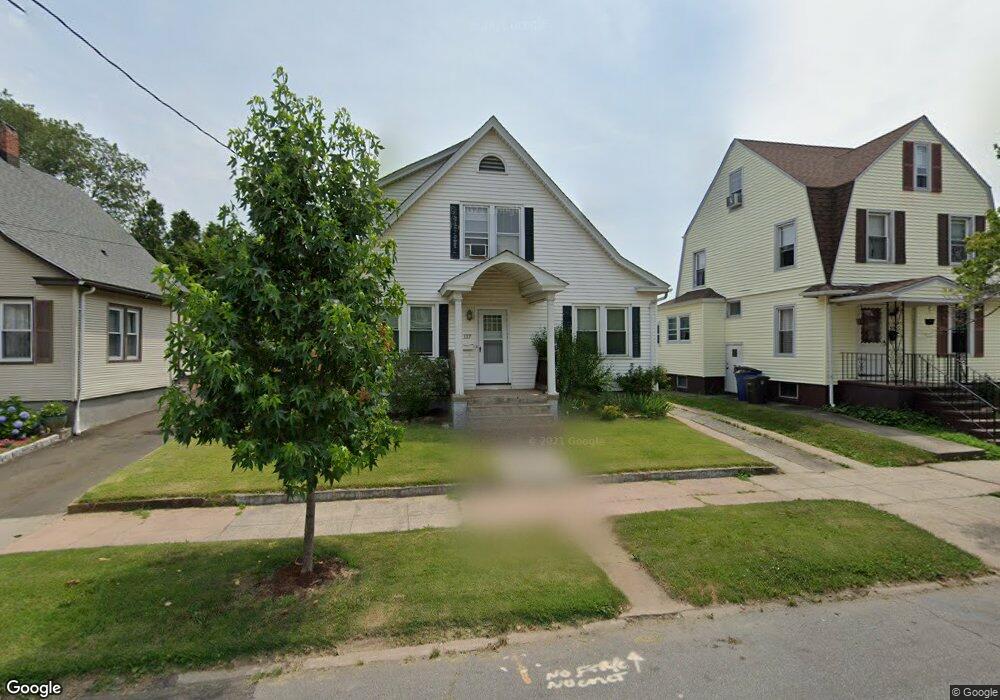
117 Huntington Ave New Haven, CT 06512
Annex NeighborhoodEstimated Value: $306,000 - $357,000
3
Beds
2
Baths
1,285
Sq Ft
$255/Sq Ft
Est. Value
About This Home
This home is located at 117 Huntington Ave, New Haven, CT 06512 and is currently estimated at $327,494, approximately $254 per square foot. 117 Huntington Ave is a home located in New Haven County with nearby schools including Cold Spring School and Pathway School.
Ownership History
Date
Name
Owned For
Owner Type
Purchase Details
Closed on
May 28, 2010
Sold by
Mongillo Lisa
Bought by
Melien Andrew
Current Estimated Value
Home Financials for this Owner
Home Financials are based on the most recent Mortgage that was taken out on this home.
Original Mortgage
$132,800
Outstanding Balance
$89,699
Interest Rate
5.13%
Estimated Equity
$237,795
Purchase Details
Closed on
Apr 2, 2001
Sold by
Higgins Gerald F and Higgins Andrea P
Bought by
Romans Kenneth T
Home Financials for this Owner
Home Financials are based on the most recent Mortgage that was taken out on this home.
Original Mortgage
$110,600
Interest Rate
6.96%
Purchase Details
Closed on
Nov 17, 1995
Sold by
Fiondella John Est
Bought by
Higgins Gerald F and Higgins Andrea P
Home Financials for this Owner
Home Financials are based on the most recent Mortgage that was taken out on this home.
Original Mortgage
$66,500
Interest Rate
7.53%
Mortgage Type
Unknown
Create a Home Valuation Report for This Property
The Home Valuation Report is an in-depth analysis detailing your home's value as well as a comparison with similar homes in the area
Home Values in the Area
Average Home Value in this Area
Purchase History
| Date | Buyer | Sale Price | Title Company |
|---|---|---|---|
| Melien Andrew | $166,000 | -- | |
| Romans Kenneth T | $112,000 | -- | |
| Higgins Gerald F | $70,000 | -- |
Source: Public Records
Mortgage History
| Date | Status | Borrower | Loan Amount |
|---|---|---|---|
| Open | Higgins Gerald F | $132,800 | |
| Previous Owner | Higgins Gerald F | $110,600 | |
| Previous Owner | Higgins Gerald F | $66,500 | |
| Closed | Higgins Gerald F | $6,230 | |
| Closed | Higgins Gerald F | $3,000 |
Source: Public Records
Tax History Compared to Growth
Tax History
| Year | Tax Paid | Tax Assessment Tax Assessment Total Assessment is a certain percentage of the fair market value that is determined by local assessors to be the total taxable value of land and additions on the property. | Land | Improvement |
|---|---|---|---|---|
| 2025 | $5,935 | $150,640 | $50,820 | $99,820 |
| 2024 | $5,800 | $150,640 | $50,820 | $99,820 |
| 2023 | $5,604 | $150,640 | $50,820 | $99,820 |
| 2022 | $5,988 | $150,640 | $50,820 | $99,820 |
| 2021 | $4,767 | $108,640 | $29,050 | $79,590 |
| 2020 | $4,767 | $108,640 | $29,050 | $79,590 |
| 2019 | $4,669 | $108,640 | $29,050 | $79,590 |
| 2018 | $4,669 | $108,640 | $29,050 | $79,590 |
| 2017 | $4,202 | $108,640 | $29,050 | $79,590 |
| 2016 | $4,369 | $105,140 | $29,050 | $76,090 |
| 2015 | $4,369 | $105,140 | $29,050 | $76,090 |
| 2014 | $4,369 | $105,140 | $29,050 | $76,090 |
Source: Public Records
Map
Nearby Homes
- 120 Harrington Ave
- 112 Harrington Ave
- 45 Huntington Ave
- 44 Huntington Ave
- 1117 Townsend Ave
- 32 Huntington Ave
- 1090 Townsend Ave
- 334 Prospect Ave Unit 334
- 666 Woodward Ave Unit 666
- 20 Ashland Place
- 18 Lenox St
- 62 Huntington Rd Unit 7
- 34 Hughes St
- 133 Charter Oak Ave
- 66 Elizabeth Ann Dr
- 516 Woodward Ave
- 30 Upson Terrace
- 444 Woodward Ave
- 74 Milton St
- 98 Quinnipiac Ave
- 115 Huntington Ave
- 123 Huntington Ave
- 113 Huntington Ave
- 125 Huntington Ave
- 111 Huntington Ave
- 116 Huntington Ave
- 131 Huntington Ave
- 114 Huntington Ave
- 110 Huntington Ave
- 70 Terrace St Unit E1
- 70 Terrace St
- 70 Terrace St Unit E6
- 70 Terrace St Unit C3
- 70 Terrace St Unit D5
- 70 Terrace St Unit F4
- 70 Terrace St Unit D4
- 70 Terrace St Unit B2
- 70 Terrace St Unit A5
- 120 Huntington Ave
- 95 Huntington Ave