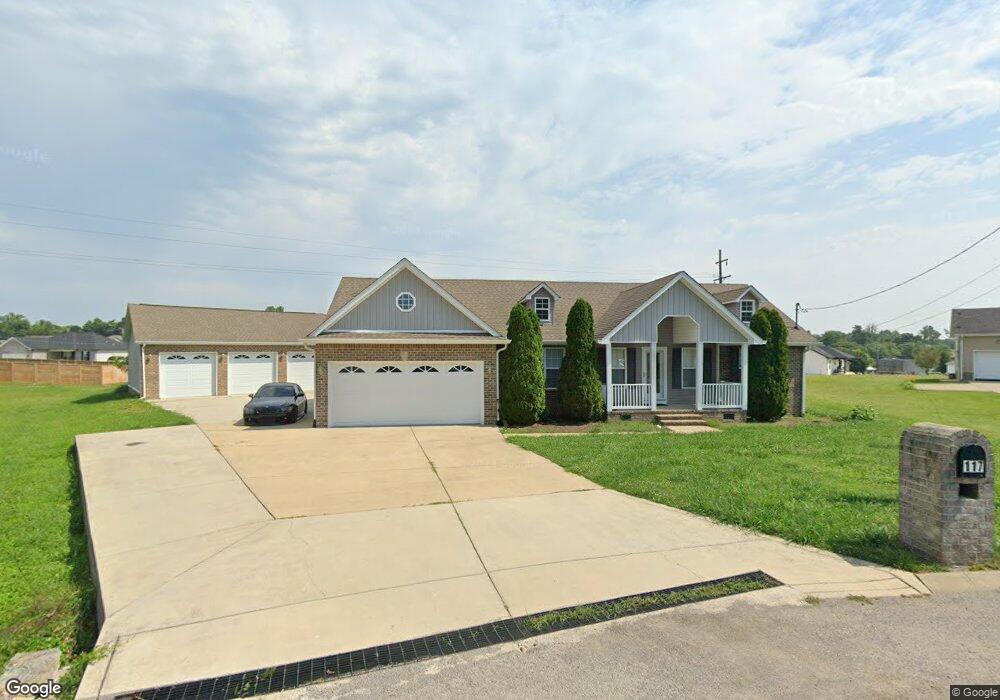
117 Kolby Dr Shelbyville, TN 37160
Estimated Value: $286,152 - $334,000
--
Bed
2
Baths
1,498
Sq Ft
$207/Sq Ft
Est. Value
About This Home
This home is located at 117 Kolby Dr, Shelbyville, TN 37160 and is currently estimated at $310,038, approximately $206 per square foot. 117 Kolby Dr is a home located in Bedford County with nearby schools including Liberty Elementary School and Christian Chapel Academy.
Ownership History
Date
Name
Owned For
Owner Type
Purchase Details
Closed on
Mar 13, 2009
Sold by
Glover Jackie
Bought by
Onate Juvenal
Current Estimated Value
Home Financials for this Owner
Home Financials are based on the most recent Mortgage that was taken out on this home.
Original Mortgage
$100,800
Interest Rate
5.13%
Purchase Details
Closed on
Sep 10, 2008
Sold by
P R Development Llc
Bought by
Glover Jackie
Purchase Details
Closed on
Jun 9, 2005
Bought by
Harmon John D/B/A Southeast Land & Livestock
Create a Home Valuation Report for This Property
The Home Valuation Report is an in-depth analysis detailing your home's value as well as a comparison with similar homes in the area
Home Values in the Area
Average Home Value in this Area
Purchase History
| Date | Buyer | Sale Price | Title Company |
|---|---|---|---|
| Onate Juvenal | $112,000 | -- | |
| Glover Jackie | $15,500 | -- | |
| Harmon John D/B/A Southeast Land & Livestock | $360,000 | -- |
Source: Public Records
Mortgage History
| Date | Status | Borrower | Loan Amount |
|---|---|---|---|
| Closed | Harmon John D/B/A Southeast Land & Livestock | $100,800 |
Source: Public Records
Tax History Compared to Growth
Tax History
| Year | Tax Paid | Tax Assessment Tax Assessment Total Assessment is a certain percentage of the fair market value that is determined by local assessors to be the total taxable value of land and additions on the property. | Land | Improvement |
|---|---|---|---|---|
| 2025 | -- | $54,000 | $0 | $0 |
| 2024 | -- | $54,000 | $7,000 | $47,000 |
| 2023 | $2,055 | $54,000 | $7,000 | $47,000 |
| 2022 | $2,115 | $54,000 | $7,000 | $47,000 |
| 2021 | $1,920 | $54,000 | $7,000 | $47,000 |
| 2020 | $1,705 | $54,000 | $7,000 | $47,000 |
| 2019 | $1,705 | $38,500 | $4,500 | $34,000 |
| 2018 | $1,667 | $38,500 | $4,500 | $34,000 |
| 2017 | $1,667 | $38,500 | $4,500 | $34,000 |
| 2016 | $1,652 | $38,500 | $4,500 | $34,000 |
| 2015 | $1,652 | $38,500 | $4,500 | $34,000 |
| 2014 | $1,384 | $35,294 | $0 | $0 |
Source: Public Records
Map
Nearby Homes