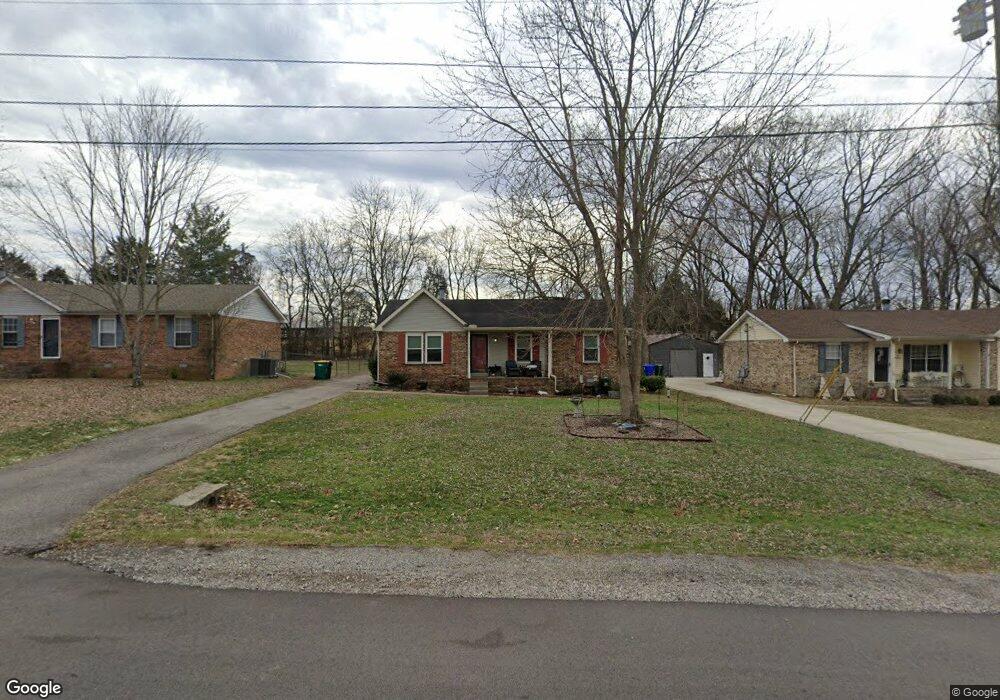
117 Kristen Ct White House, TN 37188
Estimated Value: $250,780 - $311,000
--
Bed
2
Baths
1,133
Sq Ft
$255/Sq Ft
Est. Value
About This Home
This home is located at 117 Kristen Ct, White House, TN 37188 and is currently estimated at $289,445, approximately $255 per square foot. 117 Kristen Ct is a home located in Robertson County with nearby schools including Robert F. Woodall Elementary School, White House Heritage Elementary School, and White House Heritage High School.
Ownership History
Date
Name
Owned For
Owner Type
Purchase Details
Closed on
May 21, 1999
Sold by
Coomes Bernard M
Bought by
Wililams Pieter G
Current Estimated Value
Home Financials for this Owner
Home Financials are based on the most recent Mortgage that was taken out on this home.
Original Mortgage
$96,107
Outstanding Balance
$24,544
Interest Rate
6.9%
Estimated Equity
$264,901
Purchase Details
Closed on
May 19, 1999
Bought by
Williams Pieter G and Williams Jennifer L
Home Financials for this Owner
Home Financials are based on the most recent Mortgage that was taken out on this home.
Original Mortgage
$96,107
Outstanding Balance
$24,544
Interest Rate
6.9%
Estimated Equity
$264,901
Purchase Details
Closed on
Apr 20, 1994
Sold by
Etvir Spears Joni O
Bought by
Coomes Bernard M
Purchase Details
Closed on
Jun 10, 1992
Bought by
Orand Joni Guthrie
Purchase Details
Closed on
Feb 21, 1989
Bought by
Kalisch Allen L Fleet Mortg Corp
Purchase Details
Closed on
Nov 2, 1988
Bought by
Starmax Inc
Create a Home Valuation Report for This Property
The Home Valuation Report is an in-depth analysis detailing your home's value as well as a comparison with similar homes in the area
Home Values in the Area
Average Home Value in this Area
Purchase History
| Date | Buyer | Sale Price | Title Company |
|---|---|---|---|
| Wililams Pieter G | $96,000 | -- | |
| Williams Pieter G | $96,900 | -- | |
| Coomes Bernard M | $69,950 | -- | |
| Orand Joni Guthrie | $62,600 | -- | |
| Kalisch Allen L Fleet Mortg Corp | $60,300 | -- | |
| Starmax Inc | -- | -- |
Source: Public Records
Mortgage History
| Date | Status | Borrower | Loan Amount |
|---|---|---|---|
| Open | Starmax Inc | $96,107 |
Source: Public Records
Tax History Compared to Growth
Tax History
| Year | Tax Paid | Tax Assessment Tax Assessment Total Assessment is a certain percentage of the fair market value that is determined by local assessors to be the total taxable value of land and additions on the property. | Land | Improvement |
|---|---|---|---|---|
| 2024 | -- | $52,900 | $21,250 | $31,650 |
| 2023 | $1,387 | $52,900 | $21,250 | $31,650 |
| 2022 | $1,180 | $30,550 | $5,750 | $24,800 |
| 2021 | $1,180 | $30,550 | $5,750 | $24,800 |
| 2020 | $1,104 | $30,550 | $5,750 | $24,800 |
| 2019 | $1,104 | $30,550 | $5,750 | $24,800 |
| 2018 | $1,102 | $30,550 | $5,750 | $24,800 |
| 2017 | $946 | $21,900 | $4,525 | $17,375 |
| 2016 | $946 | $21,900 | $4,525 | $17,375 |
| 2015 | $918 | $21,900 | $4,525 | $17,375 |
| 2014 | $918 | $21,900 | $4,525 | $17,375 |
Source: Public Records
Map
Nearby Homes
- 2724 Highway 31 W
- 100 Rolling Acres Dr
- 2360 Highway 31 W Unit 208
- 2360 Highway 31 W Unit 707
- 101 Laura Dr
- 4121 Wheeler Dr
- 4131 Wheeler Dr
- 4183 Wheeler Dr
- 4190 Wheeler Dr
- 4188 Wheeler Dr
- 4187 Wheeler Dr
- 4147 Wheeler Dr
- 4168 Wheeler Dr
- 4157 Wheeler Dr
- 4175 Wheeler Dr
- 7055 Sutton Dr
- 7067 Sutton Dr
- 7073 Sutton Dr
- The Grayson A Plan at Sage Farms
- The Franklin C Plan at Sage Farms
- 115 Kristen Ct
- 119 Kristen Ct
- 113 Kristen Ct
- 121 Kristen Ct
- 111 Kristen Ct
- 108 Kristen Ct
- 106 Kristen Ct
- 123 Kristen Ct
- 104 Kristen Ct
- 110 Kristen Ct
- 109 Kristen Ct
- 125 Kristen Ct
- 102 Kristen Ct
- 116 Kristen Ct
- 112 Kristen Ct
- 114 Kristen Ct
- 100 Kristen Ct
- 7928 Melton Rd
- 401 Sunnybrook Dr
- 307 Donal Terrace