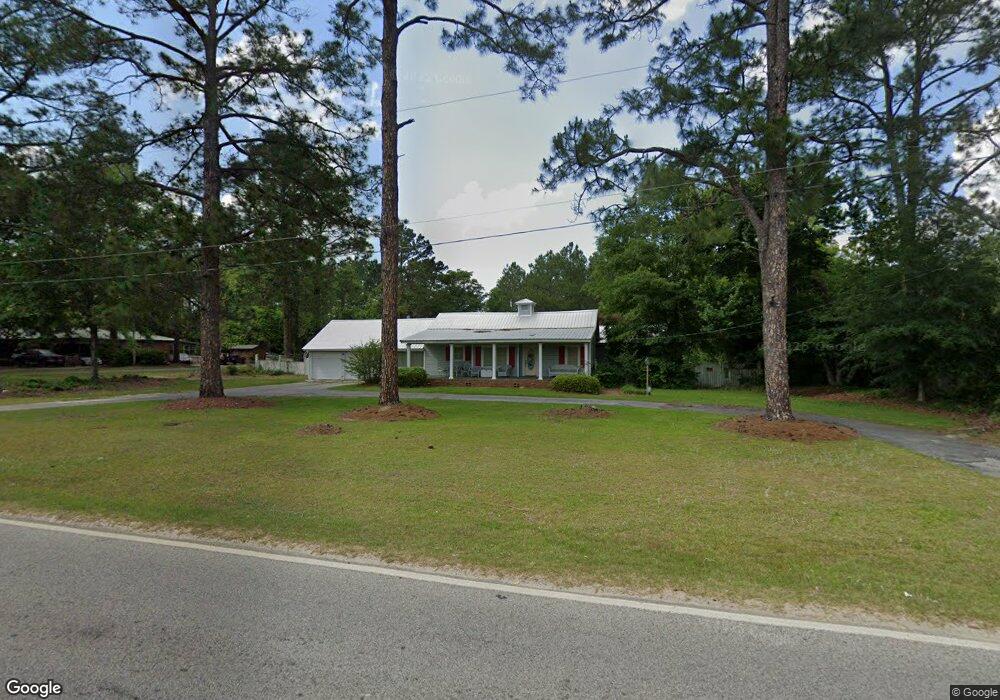
117 Lower Rebecca Rd Fitzgerald, GA 31750
Estimated Value: $201,000 - $259,000
4
Beds
2
Baths
2,898
Sq Ft
$80/Sq Ft
Est. Value
About This Home
This home is located at 117 Lower Rebecca Rd, Fitzgerald, GA 31750 and is currently estimated at $230,553, approximately $79 per square foot. 117 Lower Rebecca Rd is a home located in Ben Hill County with nearby schools including Ben Hill County Primary School, Ben Hill Elementary School, and Ben Hill County Middle School.
Ownership History
Date
Name
Owned For
Owner Type
Purchase Details
Closed on
Feb 24, 2012
Sold by
Lott Jonathan Chase
Bought by
Fussell Julia A
Current Estimated Value
Home Financials for this Owner
Home Financials are based on the most recent Mortgage that was taken out on this home.
Original Mortgage
$147,959
Outstanding Balance
$102,266
Interest Rate
4%
Mortgage Type
New Conventional
Estimated Equity
$128,287
Purchase Details
Closed on
Nov 27, 2007
Sold by
Lott Jonathan Chase
Bought by
Lott Jonathan Chase and Lott Jodi E
Purchase Details
Closed on
Dec 4, 2002
Sold by
Lott Mitzi B and Lott Harr
Bought by
Lott Jonathan Chase
Purchase Details
Closed on
Apr 18, 2000
Sold by
Lott Mitzi B
Bought by
Lott Mitzi B and Lott Harr
Purchase Details
Closed on
Oct 11, 1996
Bought by
Lott Mitzi B
Create a Home Valuation Report for This Property
The Home Valuation Report is an in-depth analysis detailing your home's value as well as a comparison with similar homes in the area
Home Values in the Area
Average Home Value in this Area
Purchase History
| Date | Buyer | Sale Price | Title Company |
|---|---|---|---|
| Fussell Julia A | $145,000 | -- | |
| Lott Jonathan Chase | -- | -- | |
| Lott Jonathan Chase | $124,500 | -- | |
| Lott Mitzi B | -- | -- | |
| Lott Mitzi B | -- | -- |
Source: Public Records
Mortgage History
| Date | Status | Borrower | Loan Amount |
|---|---|---|---|
| Open | Fussell Julia A | $147,959 |
Source: Public Records
Tax History Compared to Growth
Tax History
| Year | Tax Paid | Tax Assessment Tax Assessment Total Assessment is a certain percentage of the fair market value that is determined by local assessors to be the total taxable value of land and additions on the property. | Land | Improvement |
|---|---|---|---|---|
| 2024 | $2,385 | $83,766 | $3,200 | $80,566 |
| 2023 | $1,746 | $80,946 | $3,200 | $77,746 |
| 2022 | $2,122 | $70,156 | $3,200 | $66,956 |
| 2021 | $1,964 | $63,174 | $3,200 | $59,974 |
| 2020 | $1,977 | $62,892 | $3,200 | $59,692 |
| 2019 | $1,970 | $62,892 | $3,200 | $59,692 |
| 2018 | $2,069 | $62,540 | $3,200 | $59,340 |
| 2017 | $1,950 | $62,046 | $3,200 | $58,846 |
| 2016 | $1,863 | $62,046 | $3,200 | $58,846 |
| 2015 | -- | $62,046 | $3,200 | $58,846 |
| 2014 | -- | $61,038 | $3,200 | $57,838 |
Source: Public Records
Map
Nearby Homes
- 164 Peter Coffee Rd
- 135 Carol Cir
- 127 Carol Cir
- 110 Gaff Ave
- 137 Jack Allen Rd W
- 237 Dewey McGlamry Rd
- 117 Cooper St
- 115 Easy St
- 118 Flint St
- 342 Lower Rebecca Rd
- 123 Blueberry Ln
- 229 Hudson Rd
- 209 E Ohoopee St
- 616 N Main St
- 118 Del Ray Ct
- 608 W Sultana Dr
- 103 Meadowood Ln
- 512 N Sheridan St
- 503 N Main St
- 906 N Merrimac Dr
- 111 Lower Rebecca Rd
- 123 Lower Rebecca Rd
- 109 Lower Rebecca Rd
- 0 Lower Rebecca Rd (Primrose Unit 135109
- 374 Bowens Mill Hwy
- 124 Lower Rebecca Rd
- 378 Bowens Mill Hwy
- 131 Lower Rebecca Rd
- 130 Lower Rebecca Rd
- 133 Lower Rebecca Rd
- 109 Peter Coffee Rd
- 121 Lower Rebecca Rd
- 139 Lower Rebecca Rd
- 107 Peter Coffee Rd
- 111 Peter Coffee Rd
- 140 Lower Rebecca Rd
- 359 Bowens Mill Hwy
- 117 Peter Coffee Rd
- 108 Joshlyn Rd
- 125 Peter Coffee Rd