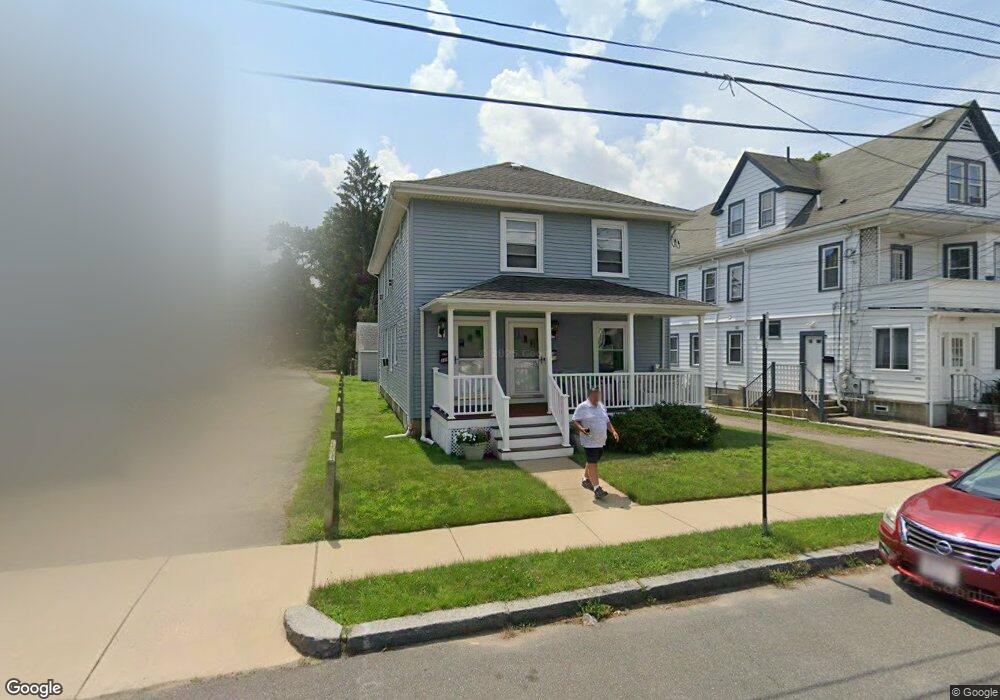
117 Merrymount Rd Quincy, MA 02169
Quincy Center NeighborhoodEstimated Value: $708,000 - $1,031,000
4
Beds
2
Baths
2,118
Sq Ft
$410/Sq Ft
Est. Value
About This Home
This home is located at 117 Merrymount Rd, Quincy, MA 02169 and is currently estimated at $868,509, approximately $410 per square foot. 117 Merrymount Rd is a home located in Norfolk County with nearby schools including Merrymount Elementary School, Central Middle School, and Quincy High School.
Ownership History
Date
Name
Owned For
Owner Type
Purchase Details
Closed on
Jan 10, 2014
Sold by
Skutul Charles W and Skutul Anna J
Bought by
Charles W Skutul Ft
Current Estimated Value
Create a Home Valuation Report for This Property
The Home Valuation Report is an in-depth analysis detailing your home's value as well as a comparison with similar homes in the area
Home Values in the Area
Average Home Value in this Area
Purchase History
| Date | Buyer | Sale Price | Title Company |
|---|---|---|---|
| Charles W Skutul Ft | -- | -- |
Source: Public Records
Mortgage History
| Date | Status | Borrower | Loan Amount |
|---|---|---|---|
| Previous Owner | Charles W Skutul Ft | $55,000 | |
| Previous Owner | Charles W Skutul Ft | $164,000 | |
| Previous Owner | Charles W Skutul Ft | $164,000 |
Source: Public Records
Tax History Compared to Growth
Tax History
| Year | Tax Paid | Tax Assessment Tax Assessment Total Assessment is a certain percentage of the fair market value that is determined by local assessors to be the total taxable value of land and additions on the property. | Land | Improvement |
|---|---|---|---|---|
| 2025 | $8,020 | $695,600 | $240,900 | $454,700 |
| 2024 | $7,386 | $655,400 | $216,700 | $438,700 |
| 2023 | $7,075 | $635,700 | $197,000 | $438,700 |
| 2022 | $7,166 | $598,200 | $179,100 | $419,100 |
| 2021 | $6,579 | $541,900 | $179,100 | $362,800 |
| 2020 | $6,507 | $523,500 | $160,500 | $363,000 |
| 2019 | $6,092 | $485,400 | $151,500 | $333,900 |
| 2018 | $6,445 | $483,100 | $160,900 | $322,200 |
| 2017 | $5,987 | $422,500 | $153,300 | $269,200 |
| 2016 | $5,648 | $393,300 | $152,800 | $240,500 |
| 2015 | $5,793 | $396,800 | $158,000 | $238,800 |
| 2014 | $4,957 | $333,600 | $147,200 | $186,400 |
Source: Public Records
Map
Nearby Homes
- 14 Samoset Ave
- 33 Samoset Ave
- 1025 Hancock St Unit 12K
- 1025 Hancock St Unit 1K
- 20 Whitney Rd Unit 4
- 20 Whitney Rd Unit 101
- 20 Whitney Rd Unit 2
- 20 Whitney Rd Unit 307
- 1 Adams St Unit 707
- 1 Adams St Unit 502
- 88 Furnace Brook Pkwy
- 1427 Quincy Shore Dr
- 105 Sea St
- 45 Oval Rd Unit 6
- 35 Estabrook Rd
- 95 Monroe Rd Unit 2L
- 165 Old Colony Ave Unit A
- 72 Oakland Ave
- 22 Newton Ave
- 163 Clay St Unit C
- 115 Merrymount Rd
- 113 Merrymount Rd
- 113 Merrymount Rd Unit 2
- 121 Merrymount Rd
- 10 Clifton St
- 125 Merrymount Rd
- 107 Merrymount Rd Unit 2
- 107 Merrymount Rd Unit 2/F
- 107 Merrymount Rd Unit 107
- 107 Merrymount Rd
- 127 Merrymount Rd
- 124 Merrymount Rd
- 283 Southern Artery
- 283 Southern Artery
- 16 Clifton St
- 129 Merrymount Rd
- 118 Merrymount Rd
- 105 Merrymount Rd
- 105 Merrymount Rd Unit 105
- 128 Merrymount Rd