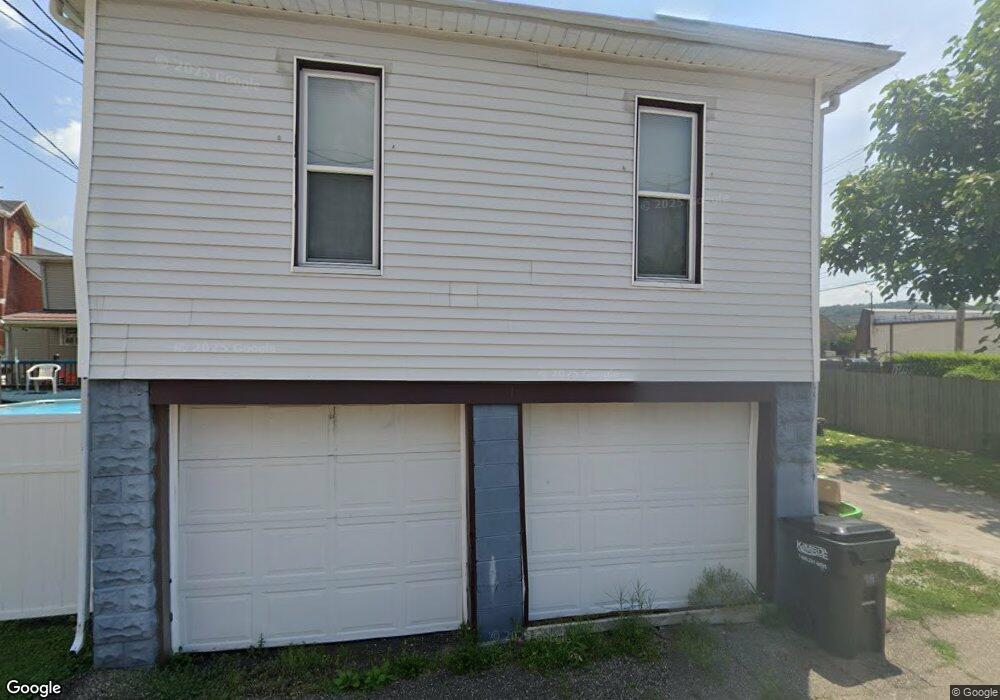
117 N 1st St Dennison, OH 44621
Estimated Value: $53,159 - $96,000
2
Beds
1
Bath
600
Sq Ft
$135/Sq Ft
Est. Value
About This Home
This home is located at 117 N 1st St, Dennison, OH 44621 and is currently estimated at $80,790, approximately $134 per square foot. 117 N 1st St is a home located in Tuscarawas County with nearby schools including Claymont High School and Immaculate Conception School.
Ownership History
Date
Name
Owned For
Owner Type
Purchase Details
Closed on
Aug 16, 2018
Sold by
Meek James L and Meek Carol A
Bought by
Johns Dwight
Current Estimated Value
Purchase Details
Closed on
Aug 14, 2009
Sold by
Meek James and Meek Carol
Bought by
Johns Dwight
Home Financials for this Owner
Home Financials are based on the most recent Mortgage that was taken out on this home.
Original Mortgage
$13,500
Interest Rate
8%
Mortgage Type
Seller Take Back
Purchase Details
Closed on
Sep 3, 2003
Sold by
Rothrock Richard E
Bought by
Meek James L and Meek Carol A
Create a Home Valuation Report for This Property
The Home Valuation Report is an in-depth analysis detailing your home's value as well as a comparison with similar homes in the area
Home Values in the Area
Average Home Value in this Area
Purchase History
| Date | Buyer | Sale Price | Title Company |
|---|---|---|---|
| Johns Dwight | $15,500 | None Available | |
| Johns Dwight | $15,500 | Alban Title | |
| Meek James L | $10,500 | -- |
Source: Public Records
Mortgage History
| Date | Status | Borrower | Loan Amount |
|---|---|---|---|
| Previous Owner | Johns Dwight | $13,500 |
Source: Public Records
Tax History Compared to Growth
Tax History
| Year | Tax Paid | Tax Assessment Tax Assessment Total Assessment is a certain percentage of the fair market value that is determined by local assessors to be the total taxable value of land and additions on the property. | Land | Improvement |
|---|---|---|---|---|
| 2024 | $470 | $12,610 | $1,200 | $11,410 |
| 2023 | $470 | $36,040 | $3,440 | $32,600 |
| 2022 | $475 | $12,614 | $1,204 | $11,410 |
| 2021 | $444 | $10,977 | $914 | $10,063 |
| 2020 | $476 | $10,977 | $914 | $10,063 |
| 2019 | $435 | $10,977 | $914 | $10,063 |
| 2018 | $385 | $9,260 | $770 | $8,490 |
| 2017 | $407 | $9,260 | $770 | $8,490 |
| 2016 | $404 | $9,260 | $770 | $8,490 |
| 2014 | $407 | $9,250 | $730 | $8,520 |
| 2013 | $413 | $9,250 | $730 | $8,520 |
Source: Public Records
Map
Nearby Homes