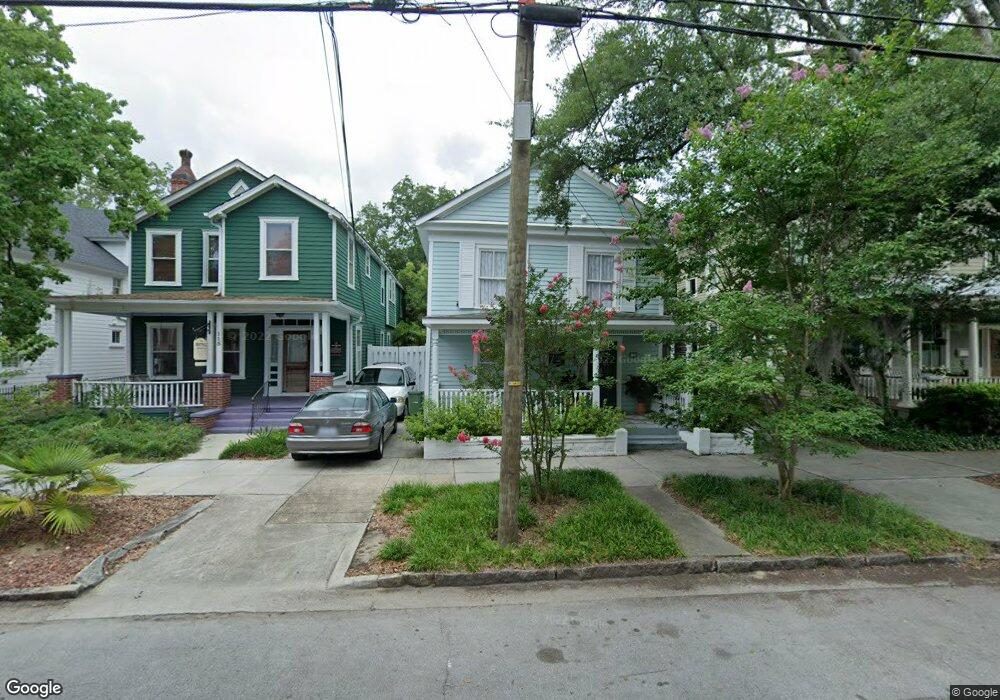
117 N 6th St Wilmington, NC 28401
Hemenway NeighborhoodEstimated Value: $493,702 - $617,000
3
Beds
2
Baths
2,141
Sq Ft
$264/Sq Ft
Est. Value
About This Home
This home is located at 117 N 6th St, Wilmington, NC 28401 and is currently estimated at $564,426, approximately $263 per square foot. 117 N 6th St is a home located in New Hanover County with nearby schools including Snipes Academy of Arts & Design, Williston Middle School, and New Hanover High School.
Ownership History
Date
Name
Owned For
Owner Type
Purchase Details
Closed on
Jan 1, 2001
Bought by
Bowers Aubrey F
Current Estimated Value
Purchase Details
Closed on
Jul 6, 1994
Sold by
Keane Timothy J Judith J
Bought by
Naser Karen J
Purchase Details
Closed on
Apr 30, 1992
Sold by
Toconis Todd J Stacy W
Bought by
Keane Timothy J Judith J
Purchase Details
Closed on
Jan 16, 1992
Sold by
Toconis Todd J Stacy W
Bought by
Toconis Todd J Stacy W
Purchase Details
Closed on
Mar 15, 1991
Sold by
Johnson Marietta Bowers
Bought by
Toconis Todd J
Purchase Details
Closed on
Feb 6, 1989
Sold by
Bowers Aubrey F
Bought by
Johnson Marietta Bowers
Create a Home Valuation Report for This Property
The Home Valuation Report is an in-depth analysis detailing your home's value as well as a comparison with similar homes in the area
Home Values in the Area
Average Home Value in this Area
Purchase History
| Date | Buyer | Sale Price | Title Company |
|---|---|---|---|
| Bowers Aubrey F | -- | -- | |
| Naser Karen J | $100,000 | -- | |
| Keane Timothy J Judith J | $63,000 | -- | |
| Toconis Todd J Stacy W | -- | -- | |
| Toconis Todd J | $500 | -- | |
| Johnson Marietta Bowers | -- | -- |
Source: Public Records
Tax History Compared to Growth
Tax History
| Year | Tax Paid | Tax Assessment Tax Assessment Total Assessment is a certain percentage of the fair market value that is determined by local assessors to be the total taxable value of land and additions on the property. | Land | Improvement |
|---|---|---|---|---|
| 2025 | $2,125 | $401,700 | $92,200 | $309,500 |
| 2023 | $2,125 | $244,200 | $102,700 | $141,500 |
| 2022 | $2,076 | $244,200 | $102,700 | $141,500 |
| 2021 | $2,090 | $244,200 | $102,700 | $141,500 |
| 2020 | $784 | $74,400 | $41,700 | $32,700 |
| 2019 | $784 | $74,400 | $41,700 | $32,700 |
| 2018 | $784 | $74,400 | $41,700 | $32,700 |
| 2017 | $784 | $74,400 | $41,700 | $32,700 |
| 2016 | $1,130 | $102,000 | $41,700 | $60,300 |
| 2015 | $1,080 | $102,000 | $41,700 | $60,300 |
| 2014 | $1,034 | $102,000 | $41,700 | $60,300 |
Source: Public Records
Map
Nearby Homes