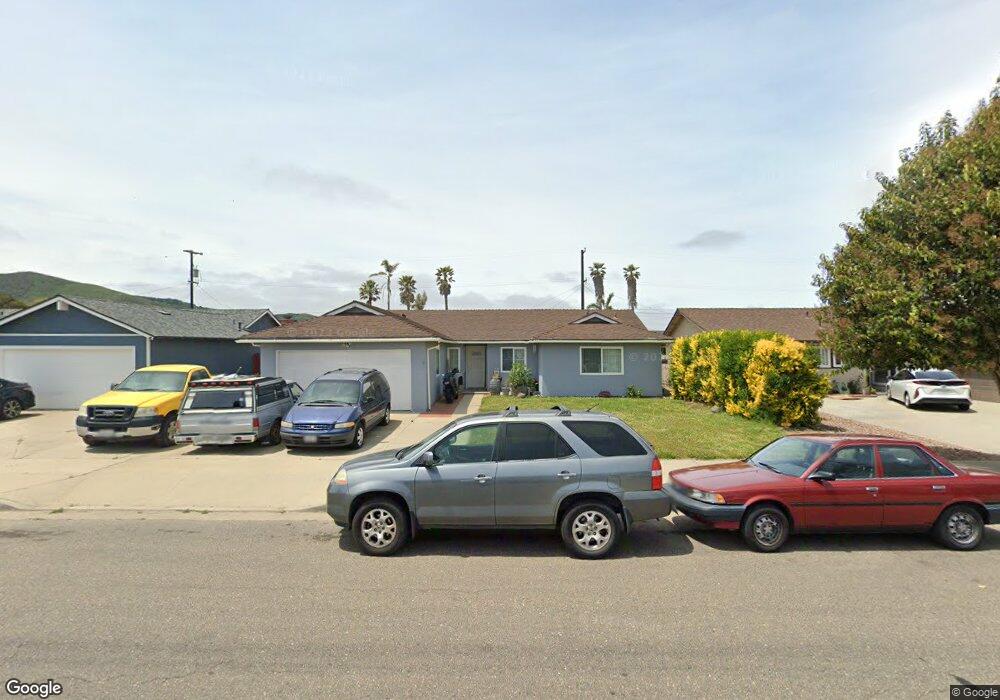
117 N Y St Lompoc, CA 93436
Estimated Value: $558,000 - $600,000
4
Beds
2
Baths
1,633
Sq Ft
$355/Sq Ft
Est. Value
About This Home
This home is located at 117 N Y St, Lompoc, CA 93436 and is currently estimated at $579,093, approximately $354 per square foot. 117 N Y St is a home located in Santa Barbara County with nearby schools including Miguelito Elementary School, Lompoc Valley Middle School, and Lompoc High School.
Ownership History
Date
Name
Owned For
Owner Type
Purchase Details
Closed on
Aug 17, 2006
Sold by
Mcginty Michael R and Mcginty Salvatrice S
Bought by
Villalobos James and Villalobos Angela Christine
Current Estimated Value
Home Financials for this Owner
Home Financials are based on the most recent Mortgage that was taken out on this home.
Original Mortgage
$374,900
Outstanding Balance
$222,628
Interest Rate
6.56%
Mortgage Type
Purchase Money Mortgage
Estimated Equity
$356,465
Purchase Details
Closed on
Jan 30, 2001
Sold by
Stewart Ronald Maurice and Stewart Shirley Marie
Bought by
Mcginty Michael R and Mcginty Salvatrice S
Home Financials for this Owner
Home Financials are based on the most recent Mortgage that was taken out on this home.
Original Mortgage
$172,850
Interest Rate
6.98%
Mortgage Type
VA
Create a Home Valuation Report for This Property
The Home Valuation Report is an in-depth analysis detailing your home's value as well as a comparison with similar homes in the area
Home Values in the Area
Average Home Value in this Area
Purchase History
| Date | Buyer | Sale Price | Title Company |
|---|---|---|---|
| Villalobos James | $375,000 | First American Title Company | |
| Mcginty Michael R | $169,500 | Chicago Title Co |
Source: Public Records
Mortgage History
| Date | Status | Borrower | Loan Amount |
|---|---|---|---|
| Open | Villalobos James | $374,900 | |
| Previous Owner | Mcginty Michael R | $172,850 |
Source: Public Records
Tax History
| Year | Tax Paid | Tax Assessment Tax Assessment Total Assessment is a certain percentage of the fair market value that is determined by local assessors to be the total taxable value of land and additions on the property. | Land | Improvement |
|---|---|---|---|---|
| 2025 | $4,713 | $453,000 | $232,000 | $221,000 |
| 2023 | $4,713 | $392,000 | $201,000 | $191,000 |
| 2022 | $4,289 | $384,000 | $197,000 | $187,000 |
| 2021 | $3,842 | $334,000 | $171,000 | $163,000 |
| 2020 | $3,481 | $303,000 | $155,000 | $148,000 |
| 2019 | $3,491 | $303,000 | $155,000 | $148,000 |
| 2018 | $3,341 | $289,000 | $148,000 | $141,000 |
| 2017 | $3,181 | $275,000 | $141,000 | $134,000 |
| 2016 | $2,892 | $250,000 | $128,000 | $122,000 |
| 2014 | $2,407 | $206,000 | $105,000 | $101,000 |
Source: Public Records
Map
Nearby Homes
- 112 N X St
- 1408 W Walnut Ave
- 1410 W Apricot Ave
- 60 Village Circle Dr
- 225 Village Circle Dr
- 267 Village Circle Dr
- 1445 Crown Cir
- 23 Village Circle Dr
- 1355 Crown Cir
- 516 N U St
- 1011 W Walnut Ave
- 1220 W Lime Ave
- 4314 W Ocean Ave
- 524 Avalon St
- 1328 W Willow Ave
- 413 S O Place
- 217 N M St
- 531 N O St
- 321 N K St
- 526 N L St
Your Personal Tour Guide
Ask me questions while you tour the home.