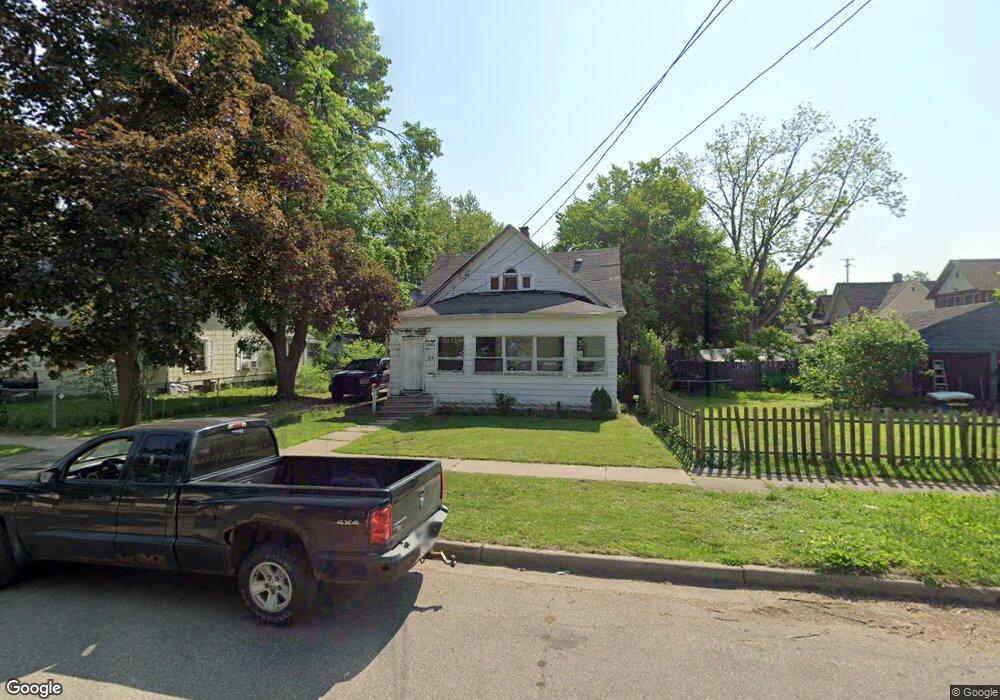
117 Nelson St Battle Creek, MI 49014
Post Franklin NeighborhoodEstimated Value: $85,000 - $101,000
2
Beds
1
Bath
1,170
Sq Ft
$79/Sq Ft
Est. Value
About This Home
This home is located at 117 Nelson St, Battle Creek, MI 49014 and is currently estimated at $92,459, approximately $79 per square foot. 117 Nelson St is a home located in Calhoun County with nearby schools including Post-Franklin Elementary School, Springfield Middle School, and Battle Creek Central High School.
Ownership History
Date
Name
Owned For
Owner Type
Purchase Details
Closed on
Mar 6, 2007
Sold by
Brown Joyce A
Bought by
Wilder Kevin
Current Estimated Value
Home Financials for this Owner
Home Financials are based on the most recent Mortgage that was taken out on this home.
Original Mortgage
$52,000
Outstanding Balance
$31,509
Interest Rate
6.28%
Mortgage Type
Purchase Money Mortgage
Estimated Equity
$60,950
Purchase Details
Closed on
Jun 11, 2003
Bought by
Brown Joyce A
Purchase Details
Closed on
Feb 17, 2000
Bought by
Brown
Purchase Details
Closed on
Dec 19, 1997
Bought by
Wolverton
Create a Home Valuation Report for This Property
The Home Valuation Report is an in-depth analysis detailing your home's value as well as a comparison with similar homes in the area
Home Values in the Area
Average Home Value in this Area
Purchase History
| Date | Buyer | Sale Price | Title Company |
|---|---|---|---|
| Wilder Kevin | $65,000 | Encompass Title Agency | |
| Brown Joyce A | -- | -- | |
| Brown | $36,500 | -- | |
| Wolverton | -- | -- |
Source: Public Records
Mortgage History
| Date | Status | Borrower | Loan Amount |
|---|---|---|---|
| Open | Wilder Kevin | $52,000 |
Source: Public Records
Tax History Compared to Growth
Tax History
| Year | Tax Paid | Tax Assessment Tax Assessment Total Assessment is a certain percentage of the fair market value that is determined by local assessors to be the total taxable value of land and additions on the property. | Land | Improvement |
|---|---|---|---|---|
| 2025 | -- | $31,100 | $0 | $0 |
| 2024 | $737 | $25,861 | $0 | $0 |
| 2023 | $938 | $23,603 | $0 | $0 |
| 2022 | $666 | $19,564 | $0 | $0 |
| 2021 | $891 | $17,893 | $0 | $0 |
| 2020 | $840 | $17,720 | $0 | $0 |
| 2019 | $887 | $14,842 | $0 | $0 |
| 2018 | $887 | $12,980 | $495 | $12,485 |
| 2017 | $999 | $18,117 | $0 | $0 |
| 2016 | $996 | $17,042 | $0 | $0 |
| 2015 | $976 | $20,057 | $2,456 | $17,601 |
| 2014 | $976 | $15,193 | $2,456 | $12,737 |
Source: Public Records
Map
Nearby Homes