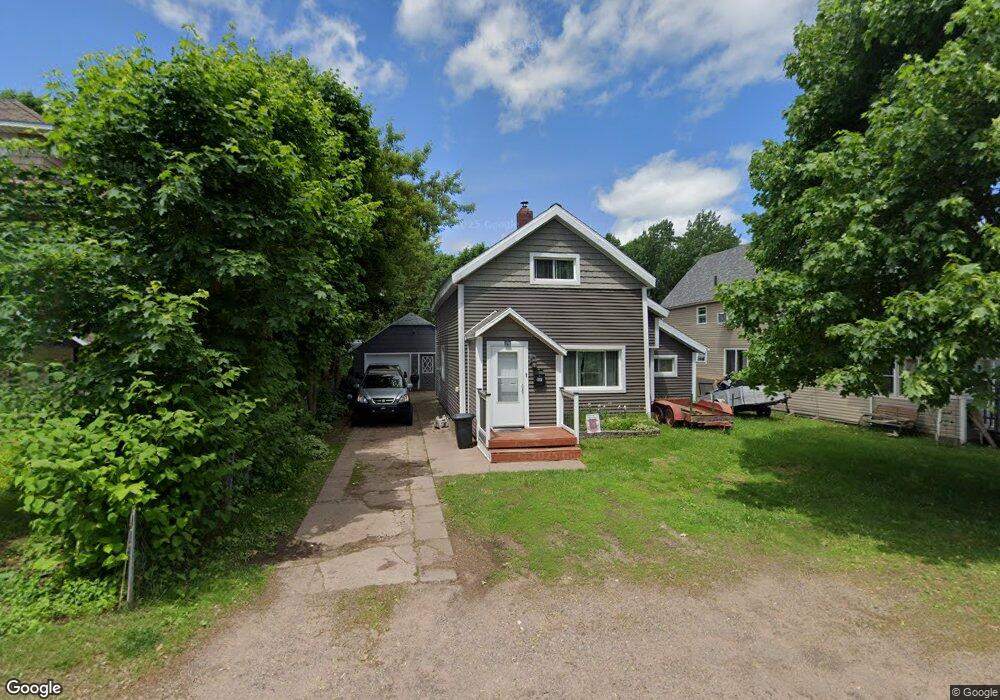
117 New York St Ishpeming, MI 49849
Estimated Value: $82,000 - $192,000
3
Beds
2
Baths
1,600
Sq Ft
$88/Sq Ft
Est. Value
About This Home
This home is located at 117 New York St, Ishpeming, MI 49849 and is currently estimated at $140,278, approximately $87 per square foot. 117 New York St is a home located in Marquette County with nearby schools including Birchview School, Ishpeming Middle School, and Ishpeming High School.
Ownership History
Date
Name
Owned For
Owner Type
Purchase Details
Closed on
May 23, 2024
Sold by
Bigger Amy Elizabeth
Bought by
Bigger Amy Elizabeth and Mcferrin Elijah Earl-Jaimz
Current Estimated Value
Purchase Details
Closed on
Aug 31, 2021
Sold by
Tuttle and Rene
Bought by
Feliciano Amy
Home Financials for this Owner
Home Financials are based on the most recent Mortgage that was taken out on this home.
Original Mortgage
$74,000
Interest Rate
2.7%
Mortgage Type
New Conventional
Purchase Details
Closed on
Jul 30, 2004
Bought by
Tuttle Bryce and Tuttle Amber
Create a Home Valuation Report for This Property
The Home Valuation Report is an in-depth analysis detailing your home's value as well as a comparison with similar homes in the area
Home Values in the Area
Average Home Value in this Area
Purchase History
| Date | Buyer | Sale Price | Title Company |
|---|---|---|---|
| Bigger Amy Elizabeth | -- | None Listed On Document | |
| Feliciano Amy | $89,000 | None Listed On Document | |
| Tuttle Bryce | $63,000 | -- |
Source: Public Records
Mortgage History
| Date | Status | Borrower | Loan Amount |
|---|---|---|---|
| Previous Owner | Feliciano Amy | $74,000 |
Source: Public Records
Tax History Compared to Growth
Tax History
| Year | Tax Paid | Tax Assessment Tax Assessment Total Assessment is a certain percentage of the fair market value that is determined by local assessors to be the total taxable value of land and additions on the property. | Land | Improvement |
|---|---|---|---|---|
| 2025 | $8 | $44,750 | $0 | $0 |
| 2024 | $8 | $33,100 | $0 | $0 |
| 2023 | $326 | $32,550 | $0 | $0 |
| 2022 | $1,461 | $28,200 | $0 | $0 |
| 2021 | $1,688 | $29,550 | $0 | $0 |
| 2020 | $1,656 | $28,200 | $0 | $0 |
| 2019 | $1,628 | $25,700 | $0 | $0 |
| 2018 | $1,583 | $24,800 | $0 | $0 |
| 2017 | $1,573 | $25,000 | $0 | $0 |
| 2016 | $1,532 | $24,200 | $0 | $0 |
| 2015 | -- | $24,200 | $0 | $0 |
| 2014 | -- | $26,100 | $0 | $0 |
| 2012 | -- | $25,650 | $0 | $0 |
Source: Public Records
Map
Nearby Homes