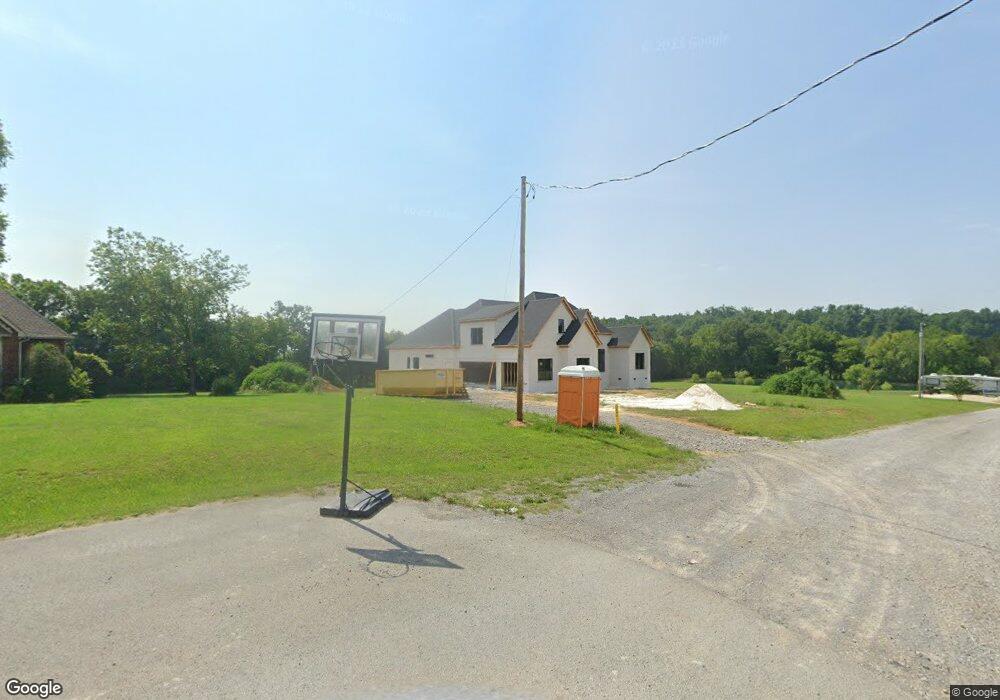
117 Peggy Ln Shelbyville, TN 37160
Estimated Value: $531,000 - $769,000
--
Bed
1
Bath
3,749
Sq Ft
$169/Sq Ft
Est. Value
About This Home
This home is located at 117 Peggy Ln, Shelbyville, TN 37160 and is currently estimated at $633,694, approximately $169 per square foot. 117 Peggy Ln is a home with nearby schools including Liberty Elementary School.
Ownership History
Date
Name
Owned For
Owner Type
Purchase Details
Closed on
Dec 21, 2023
Sold by
Ross Jeff
Bought by
Gragg Nathaniel Allen and Gragg Carrie Ellen
Current Estimated Value
Home Financials for this Owner
Home Financials are based on the most recent Mortgage that was taken out on this home.
Original Mortgage
$270,000
Outstanding Balance
$265,236
Interest Rate
7.44%
Mortgage Type
New Conventional
Estimated Equity
$368,458
Purchase Details
Closed on
May 24, 2022
Sold by
Daniel Gragg Jennifer
Bought by
Ross Jeff
Purchase Details
Closed on
Apr 14, 1976
Bought by
Daniel Bill
Create a Home Valuation Report for This Property
The Home Valuation Report is an in-depth analysis detailing your home's value as well as a comparison with similar homes in the area
Home Values in the Area
Average Home Value in this Area
Purchase History
| Date | Buyer | Sale Price | Title Company |
|---|---|---|---|
| Gragg Nathaniel Allen | $370,000 | Hitchcock Title | |
| Ross Jeff | -- | Hitchcock Title | |
| Daniel Bill | -- | -- |
Source: Public Records
Mortgage History
| Date | Status | Borrower | Loan Amount |
|---|---|---|---|
| Open | Gragg Nathaniel Allen | $270,000 |
Source: Public Records
Tax History Compared to Growth
Tax History
| Year | Tax Paid | Tax Assessment Tax Assessment Total Assessment is a certain percentage of the fair market value that is determined by local assessors to be the total taxable value of land and additions on the property. | Land | Improvement |
|---|---|---|---|---|
| 2025 | $3,806 | $163,675 | $0 | $0 |
| 2024 | $3,806 | $163,675 | $7,425 | $156,250 |
| 2023 | $173 | $7,425 | $7,425 | $0 |
| 2022 | $173 | $7,425 | $7,425 | $0 |
| 2021 | $146 | $7,425 | $7,425 | $0 |
| 2020 | $159 | $7,425 | $7,425 | $0 |
| 2019 | $159 | $5,975 | $5,975 | $0 |
| 2018 | $153 | $5,975 | $5,975 | $0 |
| 2017 | $153 | $5,975 | $5,975 | $0 |
| 2016 | $151 | $5,975 | $5,975 | $0 |
| 2015 | $151 | $5,975 | $5,975 | $0 |
| 2014 | $136 | $5,996 | $0 | $0 |
Source: Public Records
Map
Nearby Homes