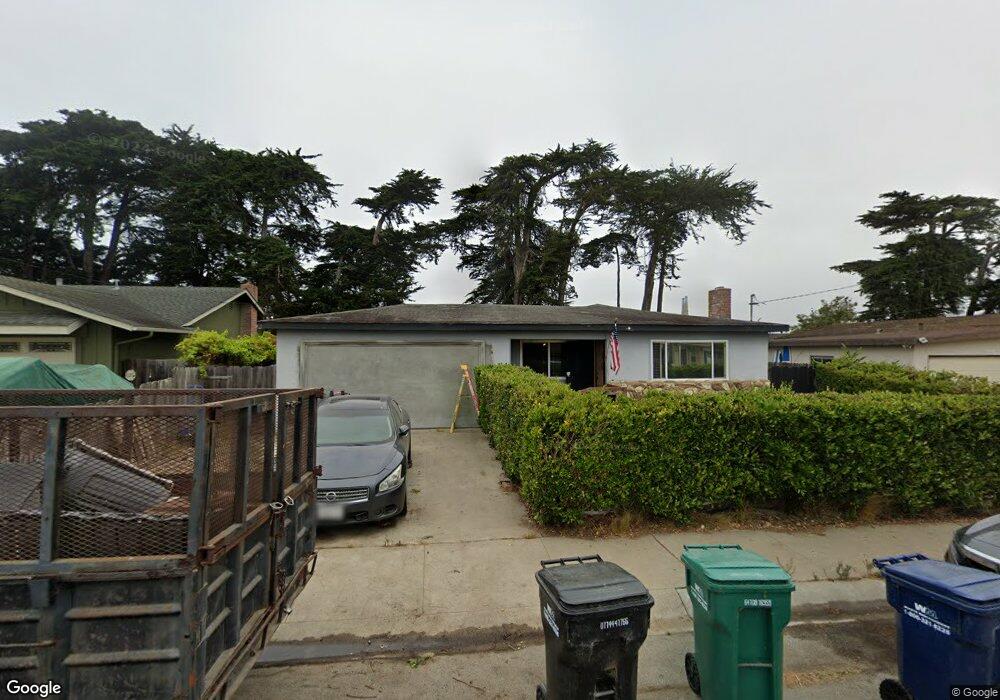
117 Pieri Ct Moss Landing, CA 95039
Estimated Value: $590,109 - $876,000
3
Beds
2
Baths
1,054
Sq Ft
$707/Sq Ft
Est. Value
About This Home
This home is located at 117 Pieri Ct, Moss Landing, CA 95039 and is currently estimated at $744,703, approximately $706 per square foot. 117 Pieri Ct is a home with nearby schools including North Monterey County Middle School and North Monterey County High School.
Ownership History
Date
Name
Owned For
Owner Type
Purchase Details
Closed on
Oct 7, 2005
Sold by
Hatten Emma J
Bought by
Hatten Nathaniel C and Hatten Emma J
Current Estimated Value
Home Financials for this Owner
Home Financials are based on the most recent Mortgage that was taken out on this home.
Original Mortgage
$270,000
Interest Rate
5.67%
Mortgage Type
New Conventional
Purchase Details
Closed on
Dec 7, 2003
Sold by
Hatten Nathaniel C
Bought by
Hatten Emma J
Home Financials for this Owner
Home Financials are based on the most recent Mortgage that was taken out on this home.
Original Mortgage
$210,000
Interest Rate
5.97%
Mortgage Type
Stand Alone First
Purchase Details
Closed on
Feb 4, 1998
Sold by
Hatten Nathaniel C and Hatten Emma J
Bought by
Hatten Nathaniel C and Hatten Emma J
Home Financials for this Owner
Home Financials are based on the most recent Mortgage that was taken out on this home.
Original Mortgage
$116,250
Interest Rate
4.95%
Create a Home Valuation Report for This Property
The Home Valuation Report is an in-depth analysis detailing your home's value as well as a comparison with similar homes in the area
Purchase History
We collect this data history from publicly available records. To have your information removed, we recommend requesting removal directly through your county’s website.
| Date | Buyer | Sale Price | Title Company |
|---|---|---|---|
| Hatten Nathaniel C | -- | Chicago Title | |
| Hatten Emma J | -- | Ticor Title | |
| Hatten Nathaniel C | -- | Old Republic Title |
Source: Public Records
Mortgage History
We collect this data history from publicly available records. To have your information removed, we recommend requesting removal directly through your county’s website.
| Date | Status | Borrower | Loan Amount |
|---|---|---|---|
| Closed | Hatten Nathaniel C | $270,000 | |
| Closed | Hatten Emma J | $210,000 | |
| Closed | Hatten Nathaniel C | $116,250 |
Source: Public Records
Tax History
| Year | Tax Paid | Tax Assessment Tax Assessment Total Assessment is a certain percentage of the fair market value that is determined by local assessors to be the total taxable value of land and additions on the property. | Land | Improvement |
|---|---|---|---|---|
| 2025 | $2,882 | $74,591 | $16,569 | $58,022 |
| 2024 | $2,882 | $73,130 | $16,245 | $56,885 |
| 2023 | $2,147 | $71,697 | $15,927 | $55,770 |
| 2022 | $2,100 | $70,292 | $15,615 | $54,677 |
| 2021 | $1,851 | $68,914 | $15,309 | $53,605 |
| 2020 | $828 | $68,209 | $15,153 | $53,056 |
| 2019 | $807 | $66,872 | $14,856 | $52,016 |
| 2018 | $792 | $65,562 | $14,565 | $50,997 |
| 2017 | $752 | $64,278 | $14,280 | $49,998 |
| 2016 | $779 | $63,018 | $14,000 | $49,018 |
| 2015 | -- | $62,072 | $13,790 | $48,282 |
| 2014 | -- | $60,857 | $13,520 | $47,337 |
Source: Public Records
Map
Nearby Homes
- 8506 Laguna Place
- 113 Laguna Place
- 7550 Sandholdt Rd
- 338 Monterey Dunes Way
- 160 Monterey Dunes Way
- 262 Monterey Dunes Way
- 10275 Merritt St
- 10298 Tembladera St
- 13265 Avila Rd
- 800 Dolan Rd Unit 29
- 260 Giberson Rd
- 0 Benson Rd
- 35995 California 1
- 13622 Monte Del Sol Unit 141
- 13624 Monte Del Sol Unit 142
- 13627 Monte Del Sol Unit 97
- 13424 Agua Caliente Unit 213
- 13720 Monte Bello Unit 105
- 13532 Agua Dulce Unit 182
- 13226 Cielo Azul Unit 250
Your Personal Tour Guide
Ask me questions while you tour the home.