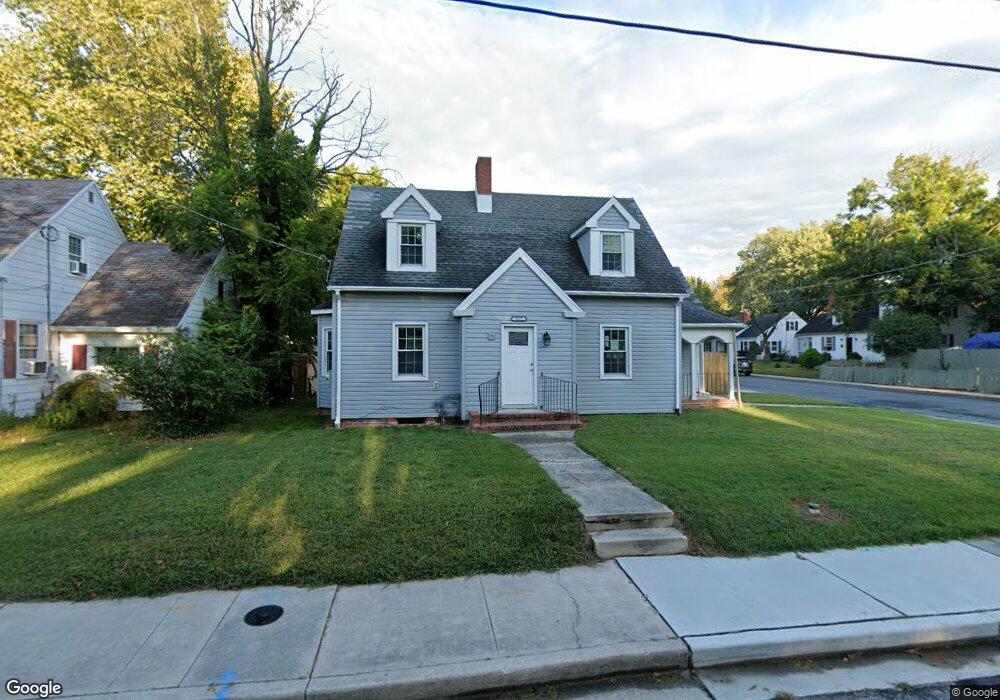
117 Priscilla St Salisbury, MD 21804
Church Street-Doverdale NeighborhoodEstimated Value: $159,929 - $218,000
--
Bed
2
Baths
1,140
Sq Ft
$168/Sq Ft
Est. Value
About This Home
This home is located at 117 Priscilla St, Salisbury, MD 21804 and is currently estimated at $191,732, approximately $168 per square foot. 117 Priscilla St is a home located in Wicomico County with nearby schools including Beaver Run Elementary School, East Salisbury Elementary School, and Wicomico Middle School.
Ownership History
Date
Name
Owned For
Owner Type
Purchase Details
Closed on
Apr 18, 2023
Sold by
Chapman Mary Patricia
Bought by
Chapman Emily Marie
Current Estimated Value
Purchase Details
Closed on
Sep 29, 2020
Sold by
Oland Pam B and Wicomico County
Bought by
W & O Investments Llc
Purchase Details
Closed on
Aug 11, 2010
Sold by
Cassell Margaret S
Bought by
Cassell Gary W
Purchase Details
Closed on
Mar 29, 1993
Sold by
Fisher William C and Fisher Leslie W
Bought by
Cassell Margaret S
Home Financials for this Owner
Home Financials are based on the most recent Mortgage that was taken out on this home.
Original Mortgage
$70,000
Interest Rate
7.5%
Purchase Details
Closed on
Sep 14, 1983
Sold by
Charrier John P and Charrier Teresa L
Bought by
Fisher William C and Fisher Leslie W
Home Financials for this Owner
Home Financials are based on the most recent Mortgage that was taken out on this home.
Original Mortgage
$45,000
Interest Rate
13.77%
Create a Home Valuation Report for This Property
The Home Valuation Report is an in-depth analysis detailing your home's value as well as a comparison with similar homes in the area
Home Values in the Area
Average Home Value in this Area
Purchase History
| Date | Buyer | Sale Price | Title Company |
|---|---|---|---|
| Chapman Emily Marie | -- | None Listed On Document | |
| Chapman Emily Marie | -- | None Listed On Document | |
| W & O Investments Llc | $13,937 | None Available | |
| Cassell Gary W | -- | -- | |
| Cassell Margaret S | $69,500 | -- | |
| Fisher William C | $49,900 | -- |
Source: Public Records
Mortgage History
| Date | Status | Borrower | Loan Amount |
|---|---|---|---|
| Previous Owner | Cassell Margaret S | $70,000 | |
| Previous Owner | Fisher William C | $45,000 |
Source: Public Records
Tax History Compared to Growth
Tax History
| Year | Tax Paid | Tax Assessment Tax Assessment Total Assessment is a certain percentage of the fair market value that is determined by local assessors to be the total taxable value of land and additions on the property. | Land | Improvement |
|---|---|---|---|---|
| 2025 | $950 | $107,967 | $0 | $0 |
| 2024 | $950 | $99,100 | $17,800 | $81,300 |
| 2023 | $853 | $86,233 | $0 | $0 |
| 2022 | $748 | $73,367 | $0 | $0 |
| 2021 | $619 | $60,500 | $17,800 | $42,700 |
| 2020 | $609 | $59,033 | $0 | $0 |
| 2019 | $603 | $57,567 | $0 | $0 |
| 2018 | $1,202 | $56,100 | $17,800 | $38,300 |
| 2017 | $1,424 | $56,100 | $0 | $0 |
| 2016 | -- | $56,100 | $0 | $0 |
| 2015 | $1,361 | $56,200 | $0 | $0 |
| 2014 | $1,361 | $56,200 | $0 | $0 |
Source: Public Records
Map
Nearby Homes
- 124 Priscilla St
- 1012 Phillips Ave
- 204 Holland Ave
- 131 Truitt St
- 211 Truitt St
- 201 Marshall St
- 309 Marshall St
- 430 Priscilla St
- 411 Dover St
- 923 Preston St
- 322 Naylor St
- 1209 Belmont Ave
- 909 Johnson St
- 608 Spring Garden Ave
- 615 Hammond St
- 113 Montleau Ave
- 625 Liberty St
- 0 Civic Avenue & Beaglin Park Dr
- 1315 Lexington St
- 722 S Park Dr
- 119 Priscilla St
- 1003 Bell Ave
- 113 Priscilla St Unit 1
- 120 Priscilla St
- 118 Priscilla St
- 1007 Bell Ave
- 1005 Bell Ave
- 1002 Bell Ave
- 1004 Phillips Ave
- 1000 Phillips Ave
- 113 Priscilla Street 1
- 116 Priscilla St
- 1002 Phillips Ave
- 122 Priscilla St
- 1006 Phillips Ave
- 1004 Bell Ave
- 1009 Bell Ave
- 1006 Bell Ave
- 114 Priscilla St
- 1008 Phillips Ave