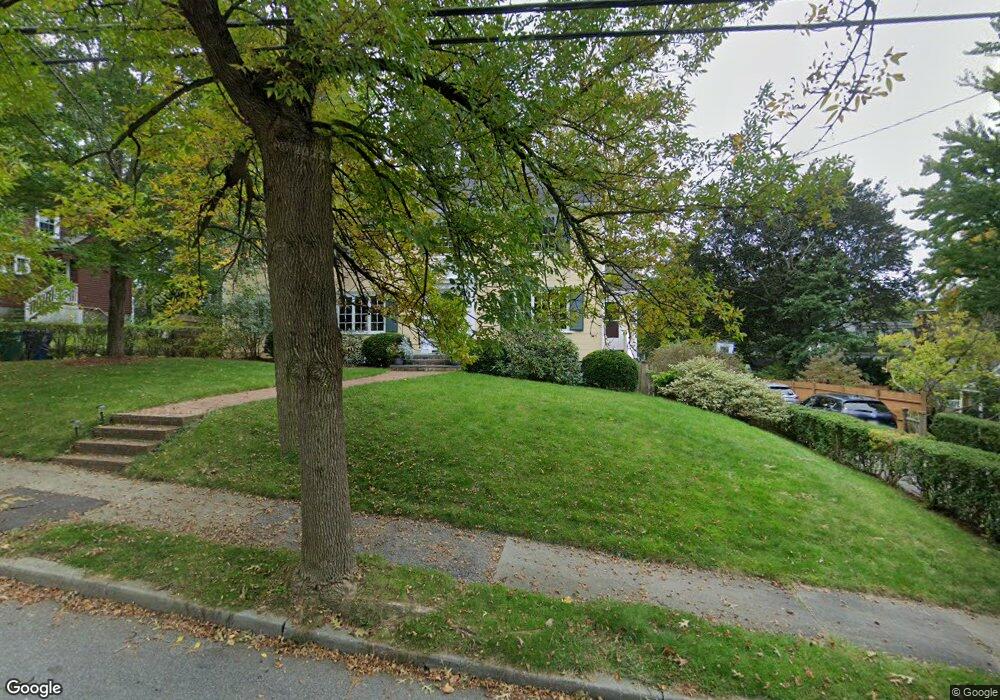
117 Prospect St West Newton, MA 02465
West Newton NeighborhoodEstimated Value: $1,638,000 - $1,801,724
4
Beds
4
Baths
2,541
Sq Ft
$679/Sq Ft
Est. Value
About This Home
This home is located at 117 Prospect St, West Newton, MA 02465 and is currently estimated at $1,724,431, approximately $678 per square foot. 117 Prospect St is a home located in Middlesex County with nearby schools including Peirce Elementary School, F.A. Day Middle School, and Newton North High School.
Ownership History
Date
Name
Owned For
Owner Type
Purchase Details
Closed on
Jun 28, 1996
Sold by
Tosney Joseph A and Tosney Virginia C
Bought by
Copley Nicholas B and Copley Janice E
Current Estimated Value
Home Financials for this Owner
Home Financials are based on the most recent Mortgage that was taken out on this home.
Original Mortgage
$255,000
Interest Rate
8.05%
Mortgage Type
Purchase Money Mortgage
Create a Home Valuation Report for This Property
The Home Valuation Report is an in-depth analysis detailing your home's value as well as a comparison with similar homes in the area
Home Values in the Area
Average Home Value in this Area
Purchase History
| Date | Buyer | Sale Price | Title Company |
|---|---|---|---|
| Copley Nicholas B | $328,000 | -- |
Source: Public Records
Mortgage History
| Date | Status | Borrower | Loan Amount |
|---|---|---|---|
| Open | Copley Nicholas B | $245,000 | |
| Closed | Copley Nicholas B | $255,000 | |
| Previous Owner | Copley Nicholas B | $60,000 | |
| Previous Owner | Copley Nicholas B | $70,000 |
Source: Public Records
Tax History Compared to Growth
Tax History
| Year | Tax Paid | Tax Assessment Tax Assessment Total Assessment is a certain percentage of the fair market value that is determined by local assessors to be the total taxable value of land and additions on the property. | Land | Improvement |
|---|---|---|---|---|
| 2025 | $14,987 | $1,529,300 | $1,174,400 | $354,900 |
| 2024 | $14,492 | $1,484,800 | $1,140,200 | $344,600 |
| 2023 | $13,861 | $1,361,600 | $875,300 | $486,300 |
| 2022 | $13,263 | $1,260,700 | $810,500 | $450,200 |
| 2021 | $12,797 | $1,189,300 | $764,600 | $424,700 |
| 2020 | $12,416 | $1,189,300 | $764,600 | $424,700 |
| 2019 | $12,067 | $1,154,700 | $742,300 | $412,400 |
| 2018 | $11,639 | $1,075,700 | $675,500 | $400,200 |
| 2017 | $11,285 | $1,014,800 | $637,300 | $377,500 |
| 2016 | $10,793 | $948,400 | $595,600 | $352,800 |
| 2015 | $10,291 | $886,400 | $556,600 | $329,800 |
Source: Public Records
Map
Nearby Homes
- 1488 Washington St Unit 1488
- 0 Duncan Rd Unit 72925240
- 17 Gilbert St
- 51 Bourne St
- 18 Sewall St
- 68 Mignon Rd
- 1639 Washington St
- 12 Inis Cir
- 10 Ruane Rd
- 10 Crescent St Unit 2
- 17 Crescent St
- 13 Weir St
- 429 Cherry St Unit 11
- 66 Webster St
- 79 Chestnut St Unit 2
- 279 Chestnut St
- 1754 Washington St
- 283 Woodland Rd
- 179 Auburn St
- 62-64 Rowe St Unit B
- 125 Prospect St
- 111 Prospect St
- 30 Tennyson Rd
- 22 Tennyson Rd
- 38 Tennyson Rd
- 120 Prospect St
- 110 Prospect St
- 133 Temple St
- 128 Prospect St
- 137 Temple St
- 27 Tennyson Rd
- 33 Tennyson Rd
- 121 Temple St
- 11 Tennyson Rd
- 21 Tennyson Rd
- 21 Tennyson Rd
- 35 Westview Terrace
- 39 Tennyson Rd
- 100 Prospect St
- 46 Westview Terrace