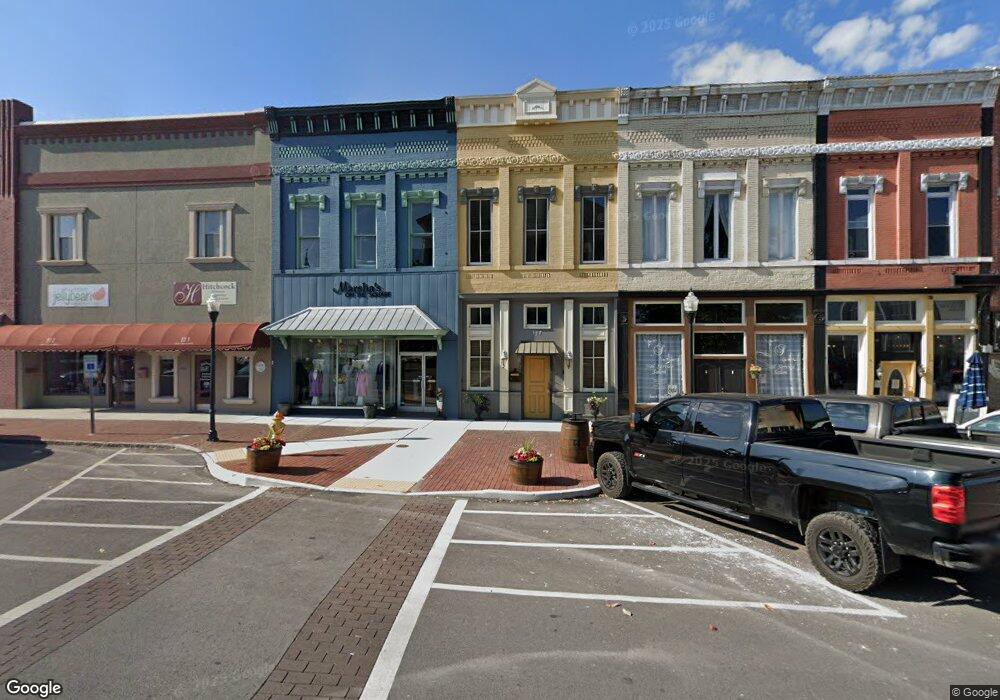
117 Public Square S Shelbyville, TN 37160
Estimated Value: $135,000
--
Bed
1
Bath
3,276
Sq Ft
$41/Sq Ft
Est. Value
About This Home
This home is located at 117 Public Square S, Shelbyville, TN 37160 and is currently priced at $135,000, approximately $41 per square foot. 117 Public Square S is a home located in Bedford County with nearby schools including East Side Elementary School, Harris Middle School, and Shelbyville Central High School.
Ownership History
Date
Name
Owned For
Owner Type
Purchase Details
Closed on
Sep 8, 2017
Sold by
Carter Kerley Laresa Lynn and Estate Of Jerry Glenn Ward
Bought by
Cartwright Emily June
Current Estimated Value
Purchase Details
Closed on
Aug 5, 2005
Sold by
Hirst Clifford E
Bought by
Ward Jerry
Home Financials for this Owner
Home Financials are based on the most recent Mortgage that was taken out on this home.
Original Mortgage
$14,200
Interest Rate
5.66%
Mortgage Type
Commercial
Purchase Details
Closed on
Jun 20, 2005
Sold by
Brandon Nancy June
Bought by
Hirst Clifford E
Home Financials for this Owner
Home Financials are based on the most recent Mortgage that was taken out on this home.
Original Mortgage
$14,200
Interest Rate
5.66%
Mortgage Type
Commercial
Purchase Details
Closed on
May 13, 1993
Bought by
Pitts Rufus Knox
Purchase Details
Closed on
Dec 13, 1991
Bought by
Pitts Rufus Knox
Purchase Details
Closed on
Jun 30, 1983
Bought by
Pitts Knox and Pitts Mildred S
Create a Home Valuation Report for This Property
The Home Valuation Report is an in-depth analysis detailing your home's value as well as a comparison with similar homes in the area
Home Values in the Area
Average Home Value in this Area
Purchase History
| Date | Buyer | Sale Price | Title Company |
|---|---|---|---|
| Cartwright Emily June | $265,000 | None Available | |
| Ward Jerry | $29,900 | -- | |
| Hirst Clifford E | $13,500 | -- | |
| Pitts Rufus Knox | -- | -- | |
| Pitts Rufus Knox | -- | -- | |
| Pitts Knox | -- | -- |
Source: Public Records
Mortgage History
| Date | Status | Borrower | Loan Amount |
|---|---|---|---|
| Previous Owner | Pitts Knox | $14,200 |
Source: Public Records
Tax History Compared to Growth
Tax History
| Year | Tax Paid | Tax Assessment Tax Assessment Total Assessment is a certain percentage of the fair market value that is determined by local assessors to be the total taxable value of land and additions on the property. | Land | Improvement |
|---|---|---|---|---|
| 2025 | -- | $50,800 | $0 | $0 |
| 2024 | -- | $50,800 | $2,875 | $47,925 |
| 2023 | $1,933 | $50,800 | $2,875 | $47,925 |
| 2022 | $1,989 | $50,800 | $2,875 | $47,925 |
| 2021 | $1,806 | $50,800 | $2,875 | $47,925 |
| 2020 | $2,073 | $50,800 | $2,875 | $47,925 |
| 2019 | $2,073 | $46,800 | $2,625 | $44,175 |
| 2018 | $2,026 | $46,800 | $2,625 | $44,175 |
| 2017 | $1,590 | $46,800 | $2,625 | $44,175 |
| 2016 | $1,575 | $36,720 | $4,200 | $32,520 |
| 2015 | $1,575 | $36,720 | $4,200 | $32,520 |
| 2014 | $1,433 | $36,547 | $0 | $0 |
Source: Public Records
Map
Nearby Homes
- 0 E Depot St
- 220 Walnut St
- 527 Deery St
- 418 Riverview Dr
- 709 Belmont Ave
- 415 Myers St
- 411 Myers St
- 0 Hilltop Rd Unit RTC3001632
- 0 Hilltop Rd Unit RTC2897754
- 105 Dogwood Ct
- 120 Dogwood Ct
- 703 Landers St
- 714 King Ave
- 639 Deery St
- 500 Park Place
- 724 Alton Ave
- 320 White St
- 112 Elizabeth St
- 627 E Lane St
- 703 Deery St
- 117 S Side Square
- 105 N Spring St
- 121 Public Square S
- 103 Public Square W
- 105 S Side Square
- 101 S Side Square
- 100 S Main St
- 119 Mcgrew St Unit A
- 202 W Depot St
- 204 W Depot St
- 109 S Main St
- 100 E Depot St
- 1 Public Square E
- 105 W Side Square
- 105 Public Square W Unit 403
- 105 Public Square W
- 105 W Side Square
- 102 Public Square E
- 209 E Depot St
- 112 Public Square E Unit 2E