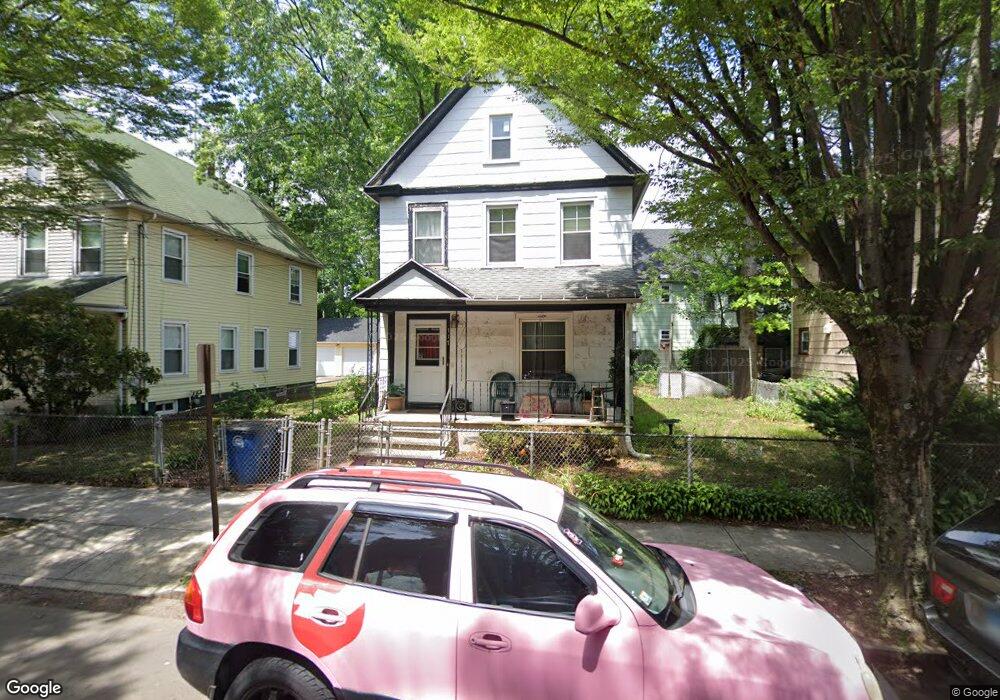
117 Read St New Haven, CT 06511
Newhallville NeighborhoodEstimated Value: $240,000 - $333,000
3
Beds
1
Bath
1,280
Sq Ft
$222/Sq Ft
Est. Value
About This Home
This home is located at 117 Read St, New Haven, CT 06511 and is currently estimated at $284,076, approximately $221 per square foot. 117 Read St is a home located in New Haven County with nearby schools including Highville Charter School, The Foote School, and Cedarhurst School.
Ownership History
Date
Name
Owned For
Owner Type
Purchase Details
Closed on
Jul 11, 2000
Sold by
Pina Linda M
Bought by
Mccoy James and Mccoy Melissa
Current Estimated Value
Home Financials for this Owner
Home Financials are based on the most recent Mortgage that was taken out on this home.
Original Mortgage
$38,900
Outstanding Balance
$14,235
Interest Rate
8.55%
Estimated Equity
$269,841
Purchase Details
Closed on
Dec 11, 1987
Sold by
Connolly Mercy B
Bought by
Pina Linda M
Home Financials for this Owner
Home Financials are based on the most recent Mortgage that was taken out on this home.
Original Mortgage
$87,500
Interest Rate
10.96%
Create a Home Valuation Report for This Property
The Home Valuation Report is an in-depth analysis detailing your home's value as well as a comparison with similar homes in the area
Home Values in the Area
Average Home Value in this Area
Purchase History
| Date | Buyer | Sale Price | Title Company |
|---|---|---|---|
| Mccoy James | $40,000 | -- | |
| Pina Linda M | $87,500 | -- |
Source: Public Records
Mortgage History
| Date | Status | Borrower | Loan Amount |
|---|---|---|---|
| Open | Pina Linda M | $1,344 | |
| Open | Pina Linda M | $38,900 | |
| Previous Owner | Pina Linda M | $87,500 | |
| Closed | Pina Linda M | $3,700 |
Source: Public Records
Tax History Compared to Growth
Tax History
| Year | Tax Paid | Tax Assessment Tax Assessment Total Assessment is a certain percentage of the fair market value that is determined by local assessors to be the total taxable value of land and additions on the property. | Land | Improvement |
|---|---|---|---|---|
| 2025 | $4,526 | $114,870 | $31,570 | $83,300 |
| 2024 | $4,422 | $114,870 | $31,570 | $83,300 |
| 2023 | $4,273 | $114,870 | $31,570 | $83,300 |
| 2022 | $4,566 | $114,870 | $31,570 | $83,300 |
| 2021 | $3,164 | $72,100 | $25,270 | $46,830 |
| 2020 | $3,164 | $72,100 | $25,270 | $46,830 |
| 2019 | $3,099 | $72,100 | $25,270 | $46,830 |
| 2018 | $3,099 | $72,100 | $25,270 | $46,830 |
| 2017 | $2,789 | $72,100 | $25,270 | $46,830 |
| 2016 | $2,365 | $56,910 | $11,200 | $45,710 |
| 2015 | $2,365 | $56,910 | $11,200 | $45,710 |
| 2014 | $2,365 | $56,910 | $11,200 | $45,710 |
Source: Public Records
Map
Nearby Homes