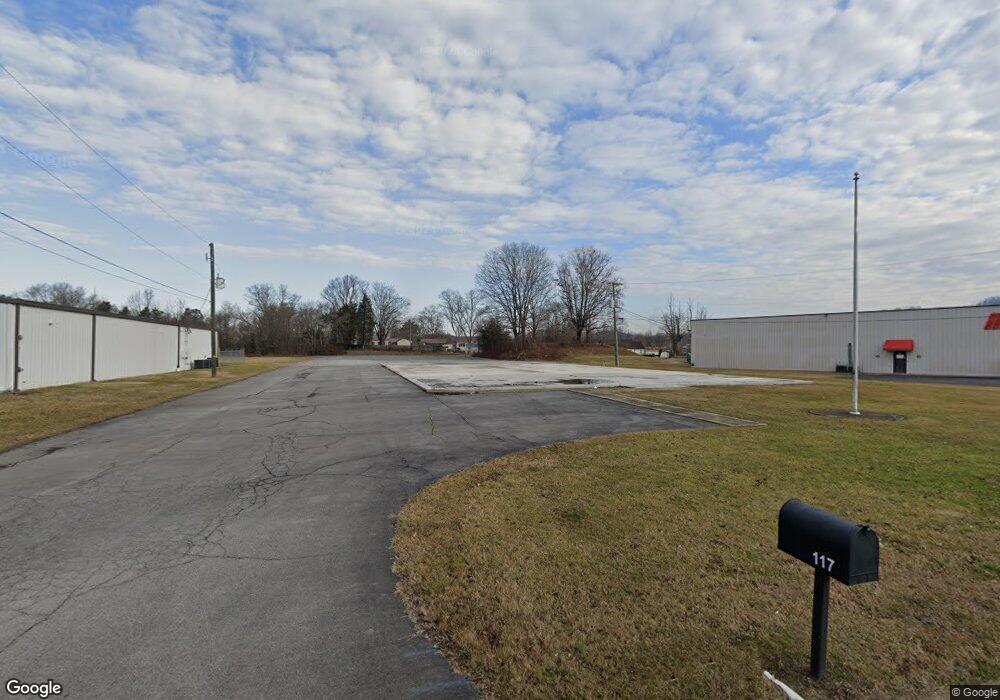
117 Regional Park Dr Kingsport, TN 37660
Estimated Value: $528,145
--
Bed
4
Baths
14,940
Sq Ft
$35/Sq Ft
Est. Value
About This Home
This home is located at 117 Regional Park Dr, Kingsport, TN 37660 and is currently priced at $528,145, approximately $35 per square foot. 117 Regional Park Dr is a home located in Sullivan County with nearby schools including Abraham Lincoln Elementary School, Ross N. Robinson Middle School, and Dobyns-Bennett High School.
Ownership History
Date
Name
Owned For
Owner Type
Purchase Details
Closed on
Aug 19, 2025
Sold by
Kc Land Company
Bought by
Vanderpool Roofing Llc
Current Estimated Value
Home Financials for this Owner
Home Financials are based on the most recent Mortgage that was taken out on this home.
Original Mortgage
$840,000
Outstanding Balance
$838,332
Interest Rate
6.72%
Mortgage Type
Construction
Purchase Details
Closed on
Jul 1, 2024
Sold by
Master Tool & Die Inc and Jet Machining Services Inc
Bought by
Kc Land Company
Home Financials for this Owner
Home Financials are based on the most recent Mortgage that was taken out on this home.
Original Mortgage
$365,000
Interest Rate
6.94%
Mortgage Type
Construction
Purchase Details
Closed on
May 26, 1988
Create a Home Valuation Report for This Property
The Home Valuation Report is an in-depth analysis detailing your home's value as well as a comparison with similar homes in the area
Home Values in the Area
Average Home Value in this Area
Purchase History
| Date | Buyer | Sale Price | Title Company |
|---|---|---|---|
| Vanderpool Roofing Llc | $485,000 | Patriot Title | |
| Vanderpool Roofing Llc | $485,000 | Patriot Title | |
| Kc Land Company | $365,000 | Heritage Title | |
| -- | $18,800 | -- |
Source: Public Records
Mortgage History
| Date | Status | Borrower | Loan Amount |
|---|---|---|---|
| Open | Vanderpool Roofing Llc | $840,000 | |
| Closed | Vanderpool Roofing Llc | $840,000 | |
| Previous Owner | Kc Land Company | $365,000 |
Source: Public Records
Tax History Compared to Growth
Tax History
| Year | Tax Paid | Tax Assessment Tax Assessment Total Assessment is a certain percentage of the fair market value that is determined by local assessors to be the total taxable value of land and additions on the property. | Land | Improvement |
|---|---|---|---|---|
| 2024 | -- | $30,800 | $30,280 | $520 |
| 2023 | $1,356 | $30,800 | $30,280 | $520 |
| 2022 | $4,600 | $104,440 | $30,280 | $74,160 |
| 2021 | $7,864 | $104,440 | $30,280 | $74,160 |
| 2020 | $4,511 | $183,560 | $30,280 | $153,280 |
| 2019 | $8,134 | $175,520 | $30,280 | $145,240 |
| 2018 | $7,943 | $175,520 | $30,280 | $145,240 |
| 2017 | $7,943 | $175,520 | $30,280 | $145,240 |
| 2016 | $7,080 | $152,400 | $30,800 | $121,600 |
| 2014 | $6,668 | $152,398 | $0 | $0 |
Source: Public Records
Map
Nearby Homes
- 2620 Pearl St
- 209 Timberland Cir
- 2209 Jett Rd
- 1908 Seaver Rd
- 205 Pond Springs Rd W
- Lot 16 Easley Dr
- 1909 Diana Rd
- Lot 21 Argonne St
- Lot 2 Pond Springs Rd W
- Lot 5 Pond Springs Rd W
- Lot 51 Raven Cir
- 2316 Reservoir Rd
- 461 Pond Springs Rd
- 2217 Glenburn Rd Unit LOT
- Lot 5 Pond Springs Rd
- 103 Willowbrook Dr
- 20 Willowbrook Dr
- 239 Willowbend Dr
- 223 Willowbend Ct
- 35 Willowbrook Ct
- 220 Reese St
- 216 Reese St
- 212 Reese St
- 2701 Pearl St
- 208 Reese St
- 2635 Pearl St
- 2632 Pearl St
- 2631 Hawaii St
- 211 Reese St
- 2631 Pearl St
- 2629 Hawaii St
- 2628 Pearl St
- 2632 Hawaii St
- 2623 Pearl St
- 2619 Pearl St
- 2628 Hawaii St
- 2645 Sullivan Gardens Pkwy Unit 2645
- 2616 Pearl St
- 2615 Pearl St
- 2621 Hawaii St