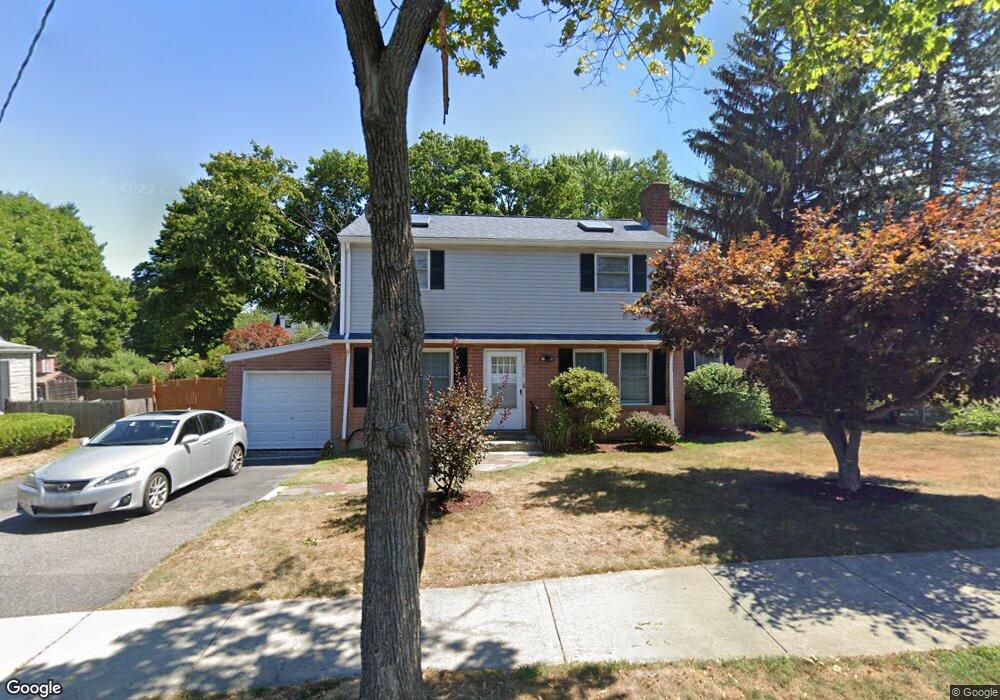
117 Russell Rd Unit 117 West Newton, MA 02465
West Newton NeighborhoodEstimated Value: $1,032,000 - $1,233,000
3
Beds
2
Baths
1,548
Sq Ft
$727/Sq Ft
Est. Value
About This Home
This home is located at 117 Russell Rd Unit 117, West Newton, MA 02465 and is currently estimated at $1,126,136, approximately $727 per square foot. 117 Russell Rd Unit 117 is a home located in Middlesex County with nearby schools including Franklin Elementary School, F.A. Day Middle School, and Newton North High School.
Ownership History
Date
Name
Owned For
Owner Type
Purchase Details
Closed on
Aug 1, 2022
Sold by
Ding Xueru and Jin Yu
Bought by
Ahn Jun M and Kim Ah R
Current Estimated Value
Home Financials for this Owner
Home Financials are based on the most recent Mortgage that was taken out on this home.
Original Mortgage
$752,000
Outstanding Balance
$718,594
Interest Rate
5.78%
Mortgage Type
Purchase Money Mortgage
Estimated Equity
$407,542
Purchase Details
Closed on
Jul 3, 2012
Sold by
Zhang Xin and Jiang Wei
Bought by
Ding Xueru and Jin Yu
Home Financials for this Owner
Home Financials are based on the most recent Mortgage that was taken out on this home.
Original Mortgage
$400,000
Interest Rate
3.78%
Mortgage Type
New Conventional
Purchase Details
Closed on
Jan 25, 2001
Sold by
Dale Richard M and Harverd Dorit E
Bought by
Jiang Wei and Zhang Xin
Home Financials for this Owner
Home Financials are based on the most recent Mortgage that was taken out on this home.
Original Mortgage
$250,000
Interest Rate
7.39%
Mortgage Type
Purchase Money Mortgage
Purchase Details
Closed on
Jul 31, 1991
Sold by
Astone Philip J and Astone Elizabeth
Bought by
Dale Richard M and Harverd Dorit E
Create a Home Valuation Report for This Property
The Home Valuation Report is an in-depth analysis detailing your home's value as well as a comparison with similar homes in the area
Home Values in the Area
Average Home Value in this Area
Purchase History
| Date | Buyer | Sale Price | Title Company |
|---|---|---|---|
| Ahn Jun M | $940,000 | None Available | |
| Ding Xueru | $500,000 | -- | |
| Ding Xueru | $500,000 | -- | |
| Jiang Wei | $363,500 | -- | |
| Dale Richard M | $200,000 | -- |
Source: Public Records
Mortgage History
| Date | Status | Borrower | Loan Amount |
|---|---|---|---|
| Open | Ahn Jun M | $752,000 | |
| Previous Owner | Ding Xueru | $400,000 | |
| Previous Owner | Dale Richard M | $250,000 | |
| Previous Owner | Dale Richard M | $250,000 |
Source: Public Records
Tax History Compared to Growth
Tax History
| Year | Tax Paid | Tax Assessment Tax Assessment Total Assessment is a certain percentage of the fair market value that is determined by local assessors to be the total taxable value of land and additions on the property. | Land | Improvement |
|---|---|---|---|---|
| 2025 | $8,898 | $908,000 | $803,200 | $104,800 |
| 2024 | $8,604 | $881,600 | $779,800 | $101,800 |
| 2023 | $7,904 | $776,400 | $592,300 | $184,100 |
| 2022 | $7,545 | $717,200 | $548,400 | $168,800 |
| 2021 | $7,280 | $676,600 | $517,400 | $159,200 |
| 2020 | $7,064 | $676,600 | $517,400 | $159,200 |
| 2019 | $6,865 | $656,900 | $502,300 | $154,600 |
| 2018 | $6,606 | $610,500 | $456,400 | $154,100 |
| 2017 | $6,404 | $575,900 | $430,600 | $145,300 |
| 2016 | $6,125 | $538,200 | $402,400 | $135,800 |
| 2015 | $5,840 | $503,000 | $376,100 | $126,900 |
Source: Public Records
Map
Nearby Homes
- 75 Cherry St
- 76 Taft Ave Unit 1
- 76 Taft Ave
- 76 Taft Ave Unit 2
- 76 Harding St
- 162 Myrtle St Unit 1
- 138 Myrtle St Unit 2
- 24 Tolman St Unit A
- 25 Tolman St Unit 2
- 9 John St
- 39 Clinton St Unit 2
- 39 Clinton St Unit 1
- 308 Newton St Unit 1
- 312 Newton St Unit 1A
- 81 Alder St
- 31-37 Washington Ave
- 47 Alder St Unit 6
- 40 Myrtle St Unit 9
- 56 Dearborn St
- 42 Alder St
- 117 Russell Rd
- 123 Russell Rd
- 109 Russell Rd
- 120 Russell Rd
- 120 Russell Rd Unit 1
- 129 Russell Rd
- 129 Russell Rd Unit SF
- 129 Russell Rd Unit 1
- 112 Russell Rd
- 19 Sylvester Rd
- 69 Cherry St
- 69 Cherry St Unit 2
- 69 Cherry St Unit 3
- 126 Russell Rd Unit 126
- 126 Russell Rd Unit SF
- 53 Cherry St
- 106 Russell Rd
- 71 Cherry St Unit 1
- 71 Cherry St
- 11 Sylvester Rd