Estimated Value: $92,835 - $112,000
4
Beds
2
Baths
1,542
Sq Ft
$65/Sq Ft
Est. Value
About This Home
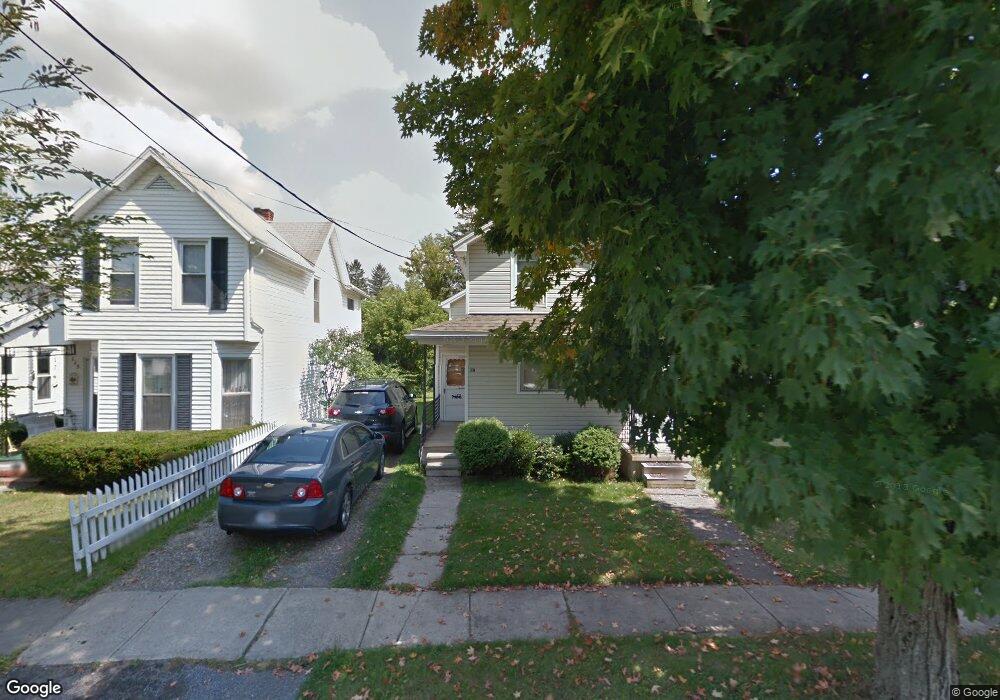
This home is located at 117 S 10th St, Olean, NY 14760 and is currently estimated at $99,959, approximately $64 per square foot. 117 S 10th St is a home located in Cattaraugus County with nearby schools including Olean Intermediate-Middle School, Olean Senior High School, and Southern Tier Catholic School.
Ownership History
Date
Name
Owned For
Owner Type
Purchase Details
Closed on
Jun 24, 2025
Sold by
Jsj and Jsj Hlasnick
Bought by
Dwellwell Rentals Llc
Current Estimated Value
Home Financials for this Owner
Home Financials are based on the most recent Mortgage that was taken out on this home.
Original Mortgage
$74,000
Outstanding Balance
$73,486
Interest Rate
6.81%
Mortgage Type
Purchase Money Mortgage
Estimated Equity
$26,473
Purchase Details
Closed on
Jan 13, 2020
Sold by
Hlasnick David B
Bought by
David Shelley M Hlasn
Purchase Details
Closed on
Dec 5, 2019
Sold by
Hlasnick David B
Bought by
David Shelley M Hlasn
Purchase Details
Closed on
Oct 4, 2002
Sold by
Blue Leonard
Bought by
Hlasnick David
Purchase Details
Closed on
Aug 10, 2000
Sold by
Olivett Robert and Olivett Patricia
Bought by
Blue Leonard
Create a Home Valuation Report for This Property
The Home Valuation Report is an in-depth analysis detailing your home's value as well as a comparison with similar homes in the area
Home Values in the Area
Average Home Value in this Area
Purchase History
| Date | Buyer | Sale Price | Title Company |
|---|---|---|---|
| Dwellwell Rentals Llc | $92,500 | None Available | |
| David Shelley M Hlasn | -- | None Available | |
| David Shelley M Hlasn | -- | None Available | |
| Hlasnick David | $42,000 | Nick Dicerbo | |
| Hlasnick David B | $42,000 | Nick Dicerbo | |
| Blue Leonard | $20,000 | Nicholas Dicerbo | |
| Blue Leonard | $20,000 | Nicholas Dicerbo |
Source: Public Records
Mortgage History
| Date | Status | Borrower | Loan Amount |
|---|---|---|---|
| Open | Dwellwell Rentals Llc | $74,000 |
Source: Public Records
Tax History
| Year | Tax Paid | Tax Assessment Tax Assessment Total Assessment is a certain percentage of the fair market value that is determined by local assessors to be the total taxable value of land and additions on the property. | Land | Improvement |
|---|---|---|---|---|
| 2025 | $3,161 | $50,000 | $4,500 | $45,500 |
| 2024 | $3,161 | $50,000 | $4,500 | $45,500 |
| 2023 | $1,882 | $50,000 | $4,500 | $45,500 |
| 2022 | $1,910 | $50,000 | $4,500 | $45,500 |
| 2021 | $1,965 | $50,000 | $4,500 | $45,500 |
| 2020 | $1,978 | $50,000 | $4,500 | $45,500 |
| 2019 | $963 | $50,000 | $4,500 | $45,500 |
| 2018 | $2,697 | $50,000 | $4,500 | $45,500 |
| 2017 | $2,027 | $50,000 | $4,500 | $45,500 |
| 2016 | $2,005 | $50,000 | $4,500 | $45,500 |
| 2015 | -- | $50,000 | $4,500 | $45,500 |
| 2014 | -- | $50,000 | $4,500 | $45,500 |
Source: Public Records
Map
Nearby Homes
Your Personal Tour Guide
Ask me questions while you tour the home.