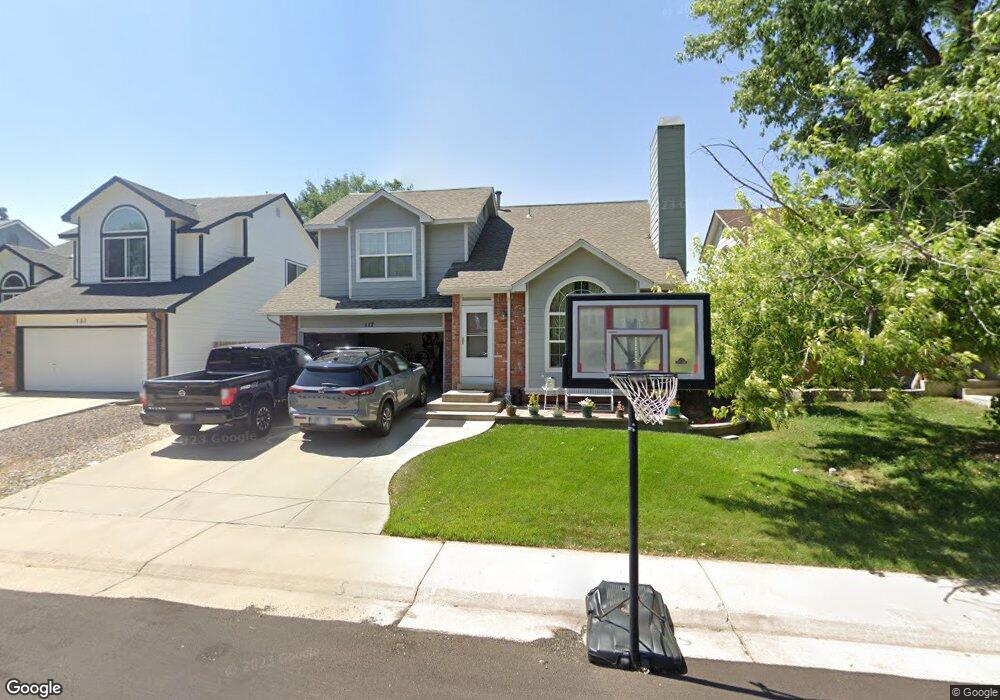
117 S Lindsey St Castle Rock, CO 80104
Founders Village NeighborhoodEstimated Value: $528,000 - $532,000
3
Beds
3
Baths
2,044
Sq Ft
$259/Sq Ft
Est. Value
About This Home
This home is located at 117 S Lindsey St, Castle Rock, CO 80104 and is currently estimated at $529,748, approximately $259 per square foot. 117 S Lindsey St is a home located in Douglas County with nearby schools including Rock Ridge Elementary School, Mesa Middle School, and Douglas County High School.
Ownership History
Date
Name
Owned For
Owner Type
Purchase Details
Closed on
Jun 14, 2021
Sold by
Esquibel Adam and Esquibel Megan
Bought by
Stewart Brianna and Johnson Jared
Current Estimated Value
Home Financials for this Owner
Home Financials are based on the most recent Mortgage that was taken out on this home.
Original Mortgage
$446,500
Outstanding Balance
$404,250
Interest Rate
2.9%
Mortgage Type
New Conventional
Estimated Equity
$125,498
Purchase Details
Closed on
Feb 15, 2017
Sold by
Hellman Rebecca
Bought by
Esquibel Adam and Esquibel Megan
Home Financials for this Owner
Home Financials are based on the most recent Mortgage that was taken out on this home.
Original Mortgage
$298,246
Interest Rate
4.2%
Mortgage Type
New Conventional
Purchase Details
Closed on
Mar 13, 2015
Sold by
Huber Melvin and Huber Diana L
Bought by
Hellman Rebecca
Home Financials for this Owner
Home Financials are based on the most recent Mortgage that was taken out on this home.
Original Mortgage
$247,500
Interest Rate
3.73%
Mortgage Type
New Conventional
Purchase Details
Closed on
Feb 26, 2015
Sold by
Huber Chad T and Huber Jennifer J
Bought by
Huber Melvin and Huber Diana L
Home Financials for this Owner
Home Financials are based on the most recent Mortgage that was taken out on this home.
Original Mortgage
$247,500
Interest Rate
3.73%
Mortgage Type
New Conventional
Purchase Details
Closed on
Nov 22, 2002
Sold by
Huber Chad T and Overdier Jennifer J
Bought by
Huber Chad T and Huber Jennifer J
Home Financials for this Owner
Home Financials are based on the most recent Mortgage that was taken out on this home.
Original Mortgage
$191,124
Interest Rate
6.13%
Mortgage Type
FHA
Purchase Details
Closed on
Nov 21, 2001
Sold by
Minney Matthew L and Hennigar Michelle L
Bought by
Huber Chad T and Overdier Jennifer J
Home Financials for this Owner
Home Financials are based on the most recent Mortgage that was taken out on this home.
Original Mortgage
$188,339
Interest Rate
6.73%
Mortgage Type
FHA
Purchase Details
Closed on
Jul 30, 1998
Sold by
Tate Gary W and Kay Lynn Kay
Bought by
Minney Matthew L and Hennigar Michelle L
Home Financials for this Owner
Home Financials are based on the most recent Mortgage that was taken out on this home.
Original Mortgage
$132,313
Interest Rate
6.94%
Mortgage Type
FHA
Purchase Details
Closed on
Jul 15, 1993
Sold by
Guido Jeffry L
Bought by
Tate Gary W and Tate Lynn Kay
Purchase Details
Closed on
Oct 31, 1986
Sold by
Richmond Belmont Ltd
Bought by
Guido Jeffry L
Create a Home Valuation Report for This Property
The Home Valuation Report is an in-depth analysis detailing your home's value as well as a comparison with similar homes in the area
Home Values in the Area
Average Home Value in this Area
Purchase History
| Date | Buyer | Sale Price | Title Company |
|---|---|---|---|
| Stewart Brianna | $490,000 | Land Title Guarantee Company | |
| Esquibel Adam | $346,000 | Fidelity National Title | |
| Hellman Rebecca | $275,000 | First American Title | |
| Huber Melvin | $258,500 | First American | |
| Huber Chad T | -- | -- | |
| Huber Chad T | $191,000 | -- | |
| Minney Matthew L | $134,000 | -- | |
| Tate Gary W | $109,000 | -- | |
| Guido Jeffry L | $96,600 | -- | |
| Richmond Belmont Ltd | -- | -- |
Source: Public Records
Mortgage History
| Date | Status | Borrower | Loan Amount |
|---|---|---|---|
| Open | Stewart Brianna | $446,500 | |
| Previous Owner | Esquibel Adam | $298,246 | |
| Previous Owner | Hellman Rebecca | $247,500 | |
| Previous Owner | Huber Chad T | $191,124 | |
| Previous Owner | Huber Chad T | $188,339 | |
| Previous Owner | Minney Matthew L | $132,313 |
Source: Public Records
Tax History Compared to Growth
Tax History
| Year | Tax Paid | Tax Assessment Tax Assessment Total Assessment is a certain percentage of the fair market value that is determined by local assessors to be the total taxable value of land and additions on the property. | Land | Improvement |
|---|---|---|---|---|
| 2024 | $5,383 | $36,450 | $7,780 | $28,670 |
| 2023 | $5,415 | $36,450 | $7,780 | $28,670 |
| 2022 | $3,933 | $24,840 | $5,780 | $19,060 |
| 2021 | $4,004 | $24,840 | $5,780 | $19,060 |
| 2020 | $3,815 | $24,350 | $4,790 | $19,560 |
| 2019 | $3,817 | $24,350 | $4,790 | $19,560 |
| 2018 | $3,255 | $20,610 | $3,900 | $16,710 |
| 2017 | $3,133 | $20,610 | $3,900 | $16,710 |
| 2016 | $2,435 | $16,720 | $3,820 | $12,900 |
| 2015 | $2,466 | $16,720 | $3,820 | $12,900 |
| 2014 | $1,014 | $13,200 | $3,420 | $9,780 |
Source: Public Records
Map
Nearby Homes
- 176 S Pembrook St
- 321 Lockwood St
- 378 Benton St
- 510 Fairhaven St
- 5181 Devon Ave
- 4590 Wakefield Ave
- 4372 E Andover Ave
- 5282 Devon Ave
- 630 Fairhaven St
- 5323 E Sandpiper Ave
- 596 S Lindsey St
- 152 Las Lunas St
- 160 Las Lunas St
- 5326 E Howe St
- 535 Howe St
- 364 N Willow St
- NA Ridge Rd
- 612 Blue Teal Dr
- 487 Hideaway Ct
- 650 Howe Cir
- 137 S Lindsey St
- 97 S Lindsey St
- 77 S Lindsey St
- 157 S Lindsey St
- 136 S Lindsey St
- 96 S Lindsey St
- 177 S Lindsey St
- 57 S Lindsey St
- 76 S Lindsey St
- 144 Hampstead Ave
- 168 Hampstead Ave
- 37 S Lindsey St
- 176 S Lindsey St
- 197 S Lindsey St
- 130 Hampstead Ave
- 4864 E Ashton Ave
- 182 Hampstead Ave
- 79 S Pembrook St
- 109 S Pembrook St
- 119 S Pembrook St