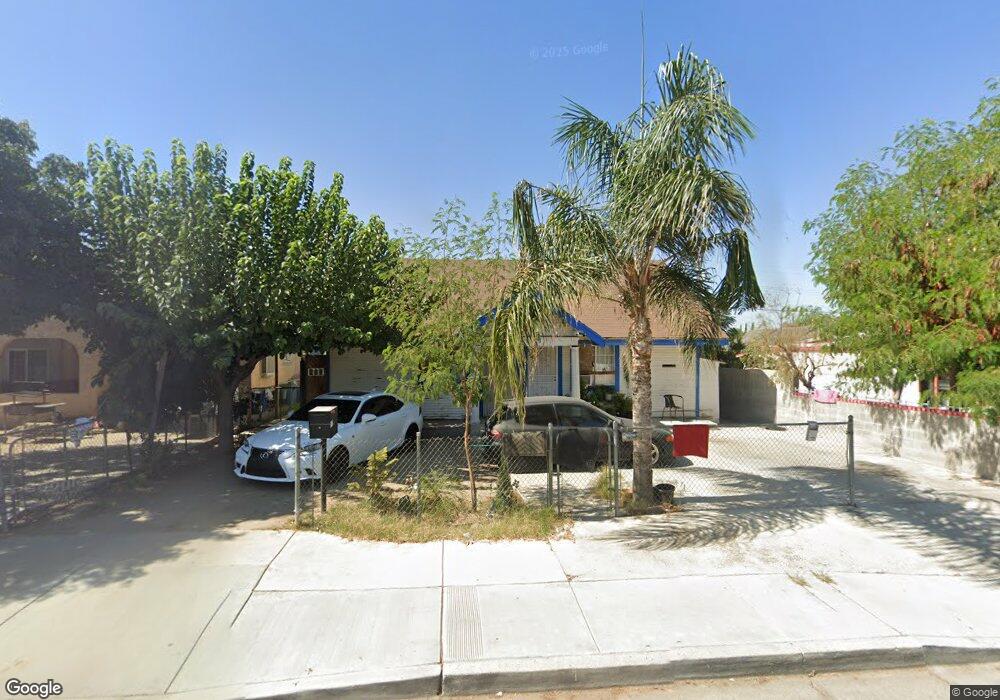
117 San Lucas St Mc Farland, CA 93250
Estimated Value: $179,000 - $290,000
2
Beds
2
Baths
958
Sq Ft
$238/Sq Ft
Est. Value
About This Home
This home is located at 117 San Lucas St, Mc Farland, CA 93250 and is currently estimated at $228,177, approximately $238 per square foot. 117 San Lucas St is a home located in Kern County with nearby schools including McFarland High School.
Ownership History
Date
Name
Owned For
Owner Type
Purchase Details
Closed on
Jul 13, 2006
Sold by
Salinas Angelica and Salinas Emilio
Bought by
Salinas Angelica
Current Estimated Value
Home Financials for this Owner
Home Financials are based on the most recent Mortgage that was taken out on this home.
Original Mortgage
$112,000
Outstanding Balance
$80,099
Interest Rate
10.75%
Mortgage Type
Balloon
Estimated Equity
$148,078
Purchase Details
Closed on
May 28, 2005
Sold by
Salinas Angelica and Salinas Aneglica
Bought by
Salinas Angelica
Home Financials for this Owner
Home Financials are based on the most recent Mortgage that was taken out on this home.
Original Mortgage
$60,000
Interest Rate
5.72%
Mortgage Type
New Conventional
Purchase Details
Closed on
Nov 8, 1999
Sold by
Salinas Emilio
Bought by
Salinas Angelica
Purchase Details
Closed on
Jan 19, 1996
Sold by
Olguin Juan and Olguin Michael
Bought by
Salinas Emilio and Salinas Angelica
Home Financials for this Owner
Home Financials are based on the most recent Mortgage that was taken out on this home.
Original Mortgage
$49,832
Interest Rate
7.18%
Mortgage Type
Seller Take Back
Create a Home Valuation Report for This Property
The Home Valuation Report is an in-depth analysis detailing your home's value as well as a comparison with similar homes in the area
Home Values in the Area
Average Home Value in this Area
Purchase History
| Date | Buyer | Sale Price | Title Company |
|---|---|---|---|
| Salinas Angelica | -- | Chicago Title Company | |
| Salinas Angelica | -- | Old Republic Title Company | |
| Salinas Angelica | -- | -- | |
| Salinas Emilio | $55,000 | Chicago Title Co |
Source: Public Records
Mortgage History
| Date | Status | Borrower | Loan Amount |
|---|---|---|---|
| Open | Salinas Angelica | $112,000 | |
| Closed | Salinas Angelica | $60,000 | |
| Previous Owner | Salinas Emilio | $49,832 |
Source: Public Records
Tax History Compared to Growth
Tax History
| Year | Tax Paid | Tax Assessment Tax Assessment Total Assessment is a certain percentage of the fair market value that is determined by local assessors to be the total taxable value of land and additions on the property. | Land | Improvement |
|---|---|---|---|---|
| 2025 | $1,319 | $91,335 | $24,902 | $66,433 |
| 2024 | $1,287 | $89,545 | $24,414 | $65,131 |
| 2023 | $1,287 | $87,790 | $23,936 | $63,854 |
| 2022 | $1,246 | $86,069 | $23,467 | $62,602 |
| 2021 | $1,123 | $84,382 | $23,007 | $61,375 |
| 2020 | $1,031 | $81,000 | $20,000 | $61,000 |
| 2019 | $973 | $79,000 | $20,000 | $59,000 |
| 2018 | $866 | $69,000 | $20,000 | $49,000 |
| 2017 | $838 | $67,000 | $20,000 | $47,000 |
| 2016 | $718 | $56,000 | $20,000 | $36,000 |
| 2015 | $682 | $53,000 | $13,000 | $40,000 |
| 2014 | $665 | $47,000 | $12,000 | $35,000 |
Source: Public Records
Map
Nearby Homes
- 148 San Lucas St
- 0 E Sherwood Ave
- 254 E Sherwood Ave
- 276 San Juan St
- 389 Mount Arbor St
- 249 Robertson Ave
- 124 4th Place
- 0 W Sherwood Ave Unit 202506495
- 0 W Sherwood Ave Unit 21453658
- 805 Price St
- 836 Fletcher St
- 852 Butte St
- 314 8th St
- 830 Davis Ave
- 450 8th St
- 583 Taylor Ave
- 1085 Mast Ave
- 737 Misty Ave
- 1043 Moscato St
- 1153 Burgundy Ct
- 125 San Lucas St
- 109 San Lucas St
- 133 San Lucas St
- 101 San Lucas St
- 141 San Lucas St
- 124 Browning Rd
- 132 Browning Rd
- 116 Browning Rd
- 140 Browning Rd
- 116 San Lucas St
- 149 San Lucas St
- 108 San Lucas St
- 124 San Lucas St
- 100 Browning Rd
- 131 San Lucas St Unit 2
- 100 1/2 San Lucas St
- 140 San Lucas St
- 157 San Lucas St
- 156 Browning Rd
- 165 San Lucas St Unit 1 & 2