117 Scotts Point Hampton, VA 23663
Phoebus NeighborhoodEstimated Value: $242,000 - $339,000
2
Beds
3
Baths
1,411
Sq Ft
$199/Sq Ft
Est. Value
About This Home
This home is located at 117 Scotts Point, Hampton, VA 23663 and is currently estimated at $280,869, approximately $199 per square foot. 117 Scotts Point is a home located in Hampton City with nearby schools including Jane H. Bryan Elementary School, Benjamin Syms Middle School, and Phoebus High School.
Ownership History
Date
Name
Owned For
Owner Type
Purchase Details
Closed on
Dec 15, 2023
Sold by
Jack Devin P and Jack Alicia E
Bought by
Jack Devin P
Current Estimated Value
Home Financials for this Owner
Home Financials are based on the most recent Mortgage that was taken out on this home.
Original Mortgage
$200,000
Outstanding Balance
$186,490
Interest Rate
7.5%
Mortgage Type
New Conventional
Estimated Equity
$94,379
Purchase Details
Closed on
Aug 18, 2020
Sold by
Bibow James E
Bought by
Jack Devin P and Jack Alicia E
Home Financials for this Owner
Home Financials are based on the most recent Mortgage that was taken out on this home.
Original Mortgage
$173,600
Interest Rate
2.9%
Mortgage Type
New Conventional
Purchase Details
Closed on
Jan 17, 2011
Sold by
Mcghee Jack D
Bought by
Bibow James E
Home Financials for this Owner
Home Financials are based on the most recent Mortgage that was taken out on this home.
Original Mortgage
$208,087
Interest Rate
4.5%
Mortgage Type
FHA
Create a Home Valuation Report for This Property
The Home Valuation Report is an in-depth analysis detailing your home's value as well as a comparison with similar homes in the area
Home Values in the Area
Average Home Value in this Area
Purchase History
| Date | Buyer | Sale Price | Title Company |
|---|---|---|---|
| Jack Devin P | -- | Stewart Title Guaranty Company | |
| Jack Devin P | $217,000 | Peninsula Title Company Inc | |
| Bibow James E | $213,500 | -- |
Source: Public Records
Mortgage History
| Date | Status | Borrower | Loan Amount |
|---|---|---|---|
| Open | Jack Devin P | $200,000 | |
| Previous Owner | Jack Devin P | $173,600 | |
| Previous Owner | Bibow James E | $208,087 |
Source: Public Records
Tax History
| Year | Tax Paid | Tax Assessment Tax Assessment Total Assessment is a certain percentage of the fair market value that is determined by local assessors to be the total taxable value of land and additions on the property. | Land | Improvement |
|---|---|---|---|---|
| 2025 | $3,046 | $254,500 | $89,300 | $165,200 |
| 2024 | $2,896 | $251,800 | $89,300 | $162,500 |
| 2023 | $3,032 | $249,100 | $89,300 | $159,800 |
| 2022 | $2,916 | $247,100 | $84,500 | $162,600 |
| 2021 | $2,547 | $194,900 | $76,500 | $118,400 |
| 2020 | $2,344 | $189,000 | $76,500 | $112,500 |
| 2019 | $2,331 | $188,000 | $76,500 | $111,500 |
| 2018 | $2,415 | $187,200 | $76,500 | $110,700 |
| 2017 | $2,415 | $0 | $0 | $0 |
| 2016 | $2,415 | $187,200 | $0 | $0 |
| 2015 | $2,415 | $0 | $0 | $0 |
| 2014 | $2,405 | $187,200 | $76,500 | $110,700 |
Source: Public Records
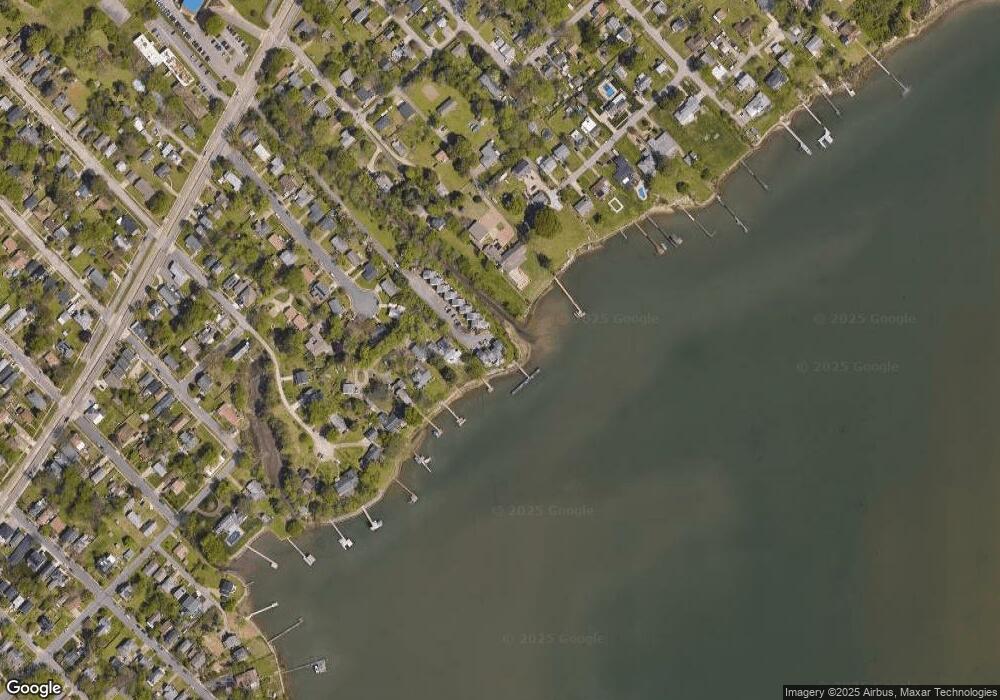
Map
Nearby Homes
- 932 Wilson Ln
- 1135 Jasmine St
- 118 Primrose Ave
- 7 Central St
- 1108 N Mallory St
- 1120 N Mallory St
- 1119 N Mallory St
- 120 E Kelly Ave
- 509 N Mallory St
- 122 E Kelly Ave
- 29 Taylor Ave E
- 14 Henderson Ln
- 54 W Virginia Ave
- 908 Old Buckroe Rd
- 109 E Cummings Ave
- 306 N Mallory St
- 704 Old Buckroe Rd
- 112 W Kelly Ave
- 725 Old Buckroe Rd
- 116 W Kelly Ave
- 119 Scotts Point
- 121 Scotts Point
- 123 Scotts Point
- 115 Scotts Point
- 113 Scotts Point
- 113 Scotts Point Unit 7
- 20 Weber Ln
- 111 Scotts Point
- 109 Scotts Point
- 109 Scotts Point Unit 109
- 107 Scotts Point
- 10 Weber Ln
- 105 Scotts Point
- 105 Scotts Point Unit 3
- 105 Scotts Point Unit 105
- 103 Scotts Point
- 101 Scotts Point
- 109 Wilson Ln
- 23 Corey Cir
- 12 Weber Ln
Your Personal Tour Guide
Ask me questions while you tour the home.