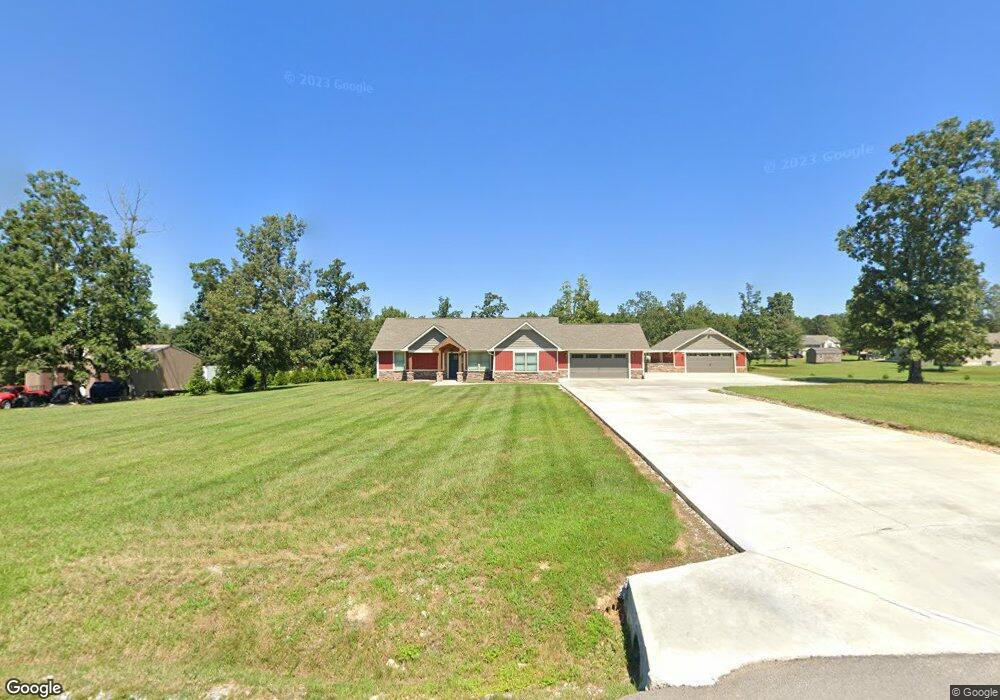
117 Sophia St Mount Pleasant, TN 38474
Estimated Value: $332,750 - $461,000
--
Bed
--
Bath
1,488
Sq Ft
$253/Sq Ft
Est. Value
About This Home
This home is located at 117 Sophia St, Mount Pleasant, TN 38474 and is currently estimated at $377,188, approximately $253 per square foot. 117 Sophia St is a home with nearby schools including Ethridge Elementary School, Ingram Sowell Elementary School, and Lawrenceburg Public Elementary School.
Ownership History
Date
Name
Owned For
Owner Type
Purchase Details
Closed on
Aug 8, 2019
Sold by
Bates Thomas
Bought by
Fritts M Todd
Current Estimated Value
Purchase Details
Closed on
May 4, 2018
Sold by
Bowers Lisa
Bought by
Bates Thomas
Purchase Details
Closed on
Dec 30, 2011
Sold by
Self Randy
Bought by
Bowers Lisa
Purchase Details
Closed on
Oct 29, 2010
Bought by
Randy Self and Bowers Lisa
Purchase Details
Closed on
Jun 18, 2010
Bought by
Peoples Bank
Purchase Details
Closed on
Sep 1, 2006
Bought by
Lige Hollis and Self Randy
Purchase Details
Closed on
Jun 9, 2005
Bought by
Gobbell Homes Inc
Purchase Details
Closed on
Oct 1, 2003
Bought by
Gobbell Homes Inc
Purchase Details
Closed on
Sep 30, 2003
Bought by
Gobbell Homes Inc
Purchase Details
Closed on
Aug 27, 2003
Bought by
Gobbell Jon
Purchase Details
Closed on
Feb 10, 1997
Purchase Details
Closed on
Sep 3, 1955
Bought by
Tucker Emma Mae
Create a Home Valuation Report for This Property
The Home Valuation Report is an in-depth analysis detailing your home's value as well as a comparison with similar homes in the area
Home Values in the Area
Average Home Value in this Area
Purchase History
| Date | Buyer | Sale Price | Title Company |
|---|---|---|---|
| Fritts M Todd | $12,000 | None Available | |
| Bates Thomas | $27,000 | None Available | |
| Bowers Lisa | -- | -- | |
| Randy Self | $153,100 | -- | |
| Peoples Bank | -- | -- | |
| Lige Hollis | -- | -- | |
| Gobbell Homes Inc | -- | -- | |
| Gobbell Homes Inc | -- | -- | |
| Gobbell Homes Inc | -- | -- | |
| Gobbell Jon | $243,200 | -- | |
| -- | $23,900 | -- | |
| Tucker Emma Mae | -- | -- |
Source: Public Records
Tax History Compared to Growth
Tax History
| Year | Tax Paid | Tax Assessment Tax Assessment Total Assessment is a certain percentage of the fair market value that is determined by local assessors to be the total taxable value of land and additions on the property. | Land | Improvement |
|---|---|---|---|---|
| 2024 | $1,293 | $64,325 | $7,075 | $57,250 |
| 2023 | $1,293 | $64,325 | $7,075 | $57,250 |
| 2022 | $1,293 | $64,325 | $7,075 | $57,250 |
| 2021 | $1,312 | $44,325 | $3,825 | $40,500 |
| 2020 | $1,066 | $44,325 | $3,825 | $40,500 |
| 2019 | $113 | $3,825 | $3,825 | $0 |
| 2018 | $113 | $3,825 | $3,825 | $0 |
| 2017 | $113 | $3,825 | $3,825 | $0 |
| 2016 | $113 | $3,825 | $3,825 | $0 |
| 2015 | $105 | $3,825 | $3,825 | $0 |
| 2014 | -- | $3,825 | $3,825 | $0 |
Source: Public Records
Map
Nearby Homes
- 0 Sophia St Unit 1669655
- 0 Sophia St Unit 1669650
- 0 Sophia St Unit 1668729
- 0 Sophia St Unit 1668720
- 0 Sophia St Unit RTC1551535
- 0 Sophia St Unit 2060595
- 80 Sophia St
- 63 Sophia St
- 351 Jon Frank Dr
- 436 Presley Cir
- 0 Sophia St Unit 1794861
- 0 Sophia St Unit 1794859
- 122 Sophia St
- 329 Gobbell Ave
- 354 Presley Cir
- 0 Sophia St
- 381 Gobbell Ave
- 38 Sophia St
- 231 Gobbell Ave
- 0 Presley Cir Unit 1904796