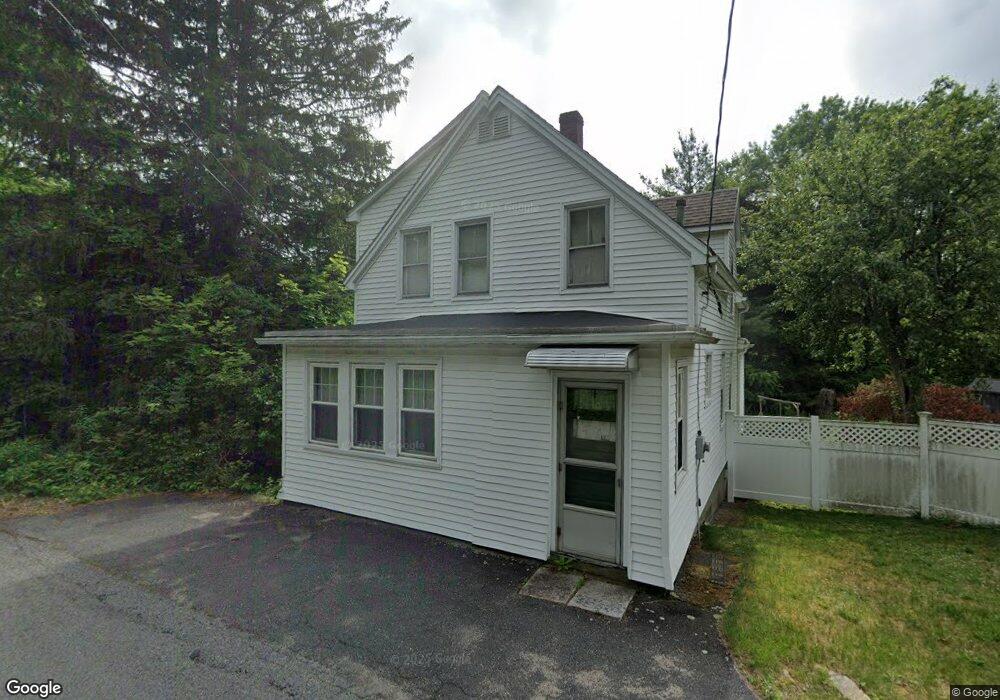
117 Spring St Foxboro, MA 02035
Estimated Value: $485,000 - $518,000
3
Beds
2
Baths
1,198
Sq Ft
$423/Sq Ft
Est. Value
About This Home
This home is located at 117 Spring St, Foxboro, MA 02035 and is currently estimated at $506,646, approximately $422 per square foot. 117 Spring St is a home located in Norfolk County with nearby schools including Foxborough High School, Foxborough Regional Charter School, and Hands-On-Montessori School.
Ownership History
Date
Name
Owned For
Owner Type
Purchase Details
Closed on
Aug 29, 1997
Sold by
Macdow Cheryl F
Bought by
Johnson Wayne F
Current Estimated Value
Home Financials for this Owner
Home Financials are based on the most recent Mortgage that was taken out on this home.
Original Mortgage
$90,000
Outstanding Balance
$13,874
Interest Rate
7.41%
Mortgage Type
Purchase Money Mortgage
Estimated Equity
$492,772
Create a Home Valuation Report for This Property
The Home Valuation Report is an in-depth analysis detailing your home's value as well as a comparison with similar homes in the area
Home Values in the Area
Average Home Value in this Area
Purchase History
| Date | Buyer | Sale Price | Title Company |
|---|---|---|---|
| Johnson Wayne F | $48,000 | -- |
Source: Public Records
Mortgage History
| Date | Status | Borrower | Loan Amount |
|---|---|---|---|
| Open | Johnson Wayne F | $90,000 |
Source: Public Records
Tax History
| Year | Tax Paid | Tax Assessment Tax Assessment Total Assessment is a certain percentage of the fair market value that is determined by local assessors to be the total taxable value of land and additions on the property. | Land | Improvement |
|---|---|---|---|---|
| 2025 | $4,840 | $366,100 | $187,200 | $178,900 |
| 2024 | $4,976 | $368,300 | $201,800 | $166,500 |
| 2023 | $4,856 | $341,700 | $192,100 | $149,600 |
| 2022 | $4,609 | $317,400 | $172,200 | $145,200 |
| 2021 | $1,237 | $305,300 | $163,500 | $141,800 |
| 2020 | $4,448 | $305,300 | $163,500 | $141,800 |
| 2019 | $4,410 | $300,000 | $164,100 | $135,900 |
| 2018 | $4,042 | $277,400 | $155,900 | $121,500 |
| 2017 | $3,916 | $260,400 | $153,300 | $107,100 |
| 2016 | $3,803 | $256,600 | $147,600 | $109,000 |
| 2015 | $3,436 | $226,200 | $110,000 | $116,200 |
| 2014 | $3,391 | $226,200 | $110,000 | $116,200 |
Source: Public Records
Map
Nearby Homes
- 4 Concetta Cir
- 619 N Main St
- 25 Kingman Ave
- 81 Chilson Ave
- 22 Pleasant St Unit C
- 356 Central St
- 266 N Main St Unit 3
- 150 Rumford Ave Unit 110
- 166 Chauncy St
- 46 Hope St
- 28 Court St
- 152 Central St
- 261 East St
- 44 Fairfield Park Unit 44
- 97 East St
- 233 Central St
- 157 Central St
- 9 Independence Dr Unit 9
- 13 Summerville Rd Unit 13
- 132 Cannon Forge Dr
Your Personal Tour Guide
Ask me questions while you tour the home.