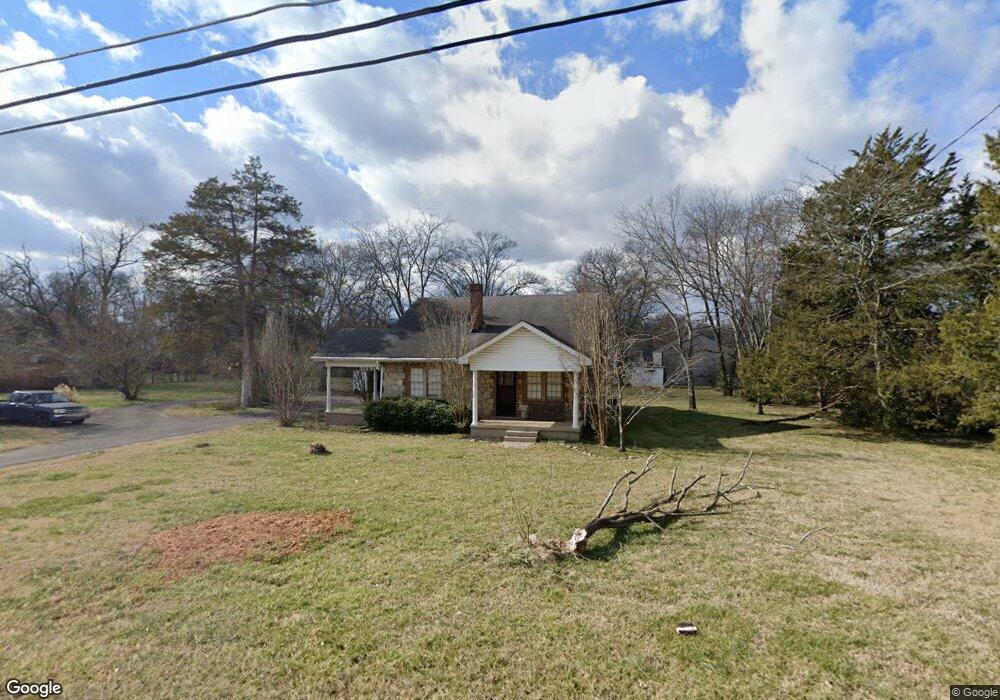
117 Twin Oak Dr Murfreesboro, TN 37130
Estimated Value: $325,747 - $360,000
--
Bed
1
Bath
1,481
Sq Ft
$230/Sq Ft
Est. Value
About This Home
This home is located at 117 Twin Oak Dr, Murfreesboro, TN 37130 and is currently estimated at $340,437, approximately $229 per square foot. 117 Twin Oak Dr is a home located in Rutherford County with nearby schools including Kittrell Elementary School, Whitworth-Buchanan Middle School, and Oakland High School.
Ownership History
Date
Name
Owned For
Owner Type
Purchase Details
Closed on
Nov 12, 2009
Sold by
Tucker J Hayden
Bought by
Crabtree William Earle
Current Estimated Value
Home Financials for this Owner
Home Financials are based on the most recent Mortgage that was taken out on this home.
Original Mortgage
$152,093
Outstanding Balance
$99,006
Interest Rate
4.94%
Estimated Equity
$241,431
Purchase Details
Closed on
Jun 24, 2009
Sold by
Tucker Rebekah Ashlee
Bought by
Tucker J Hayden
Purchase Details
Closed on
Mar 28, 2007
Sold by
Marie Brown Gladys
Bought by
Hayden Tucker J
Home Financials for this Owner
Home Financials are based on the most recent Mortgage that was taken out on this home.
Original Mortgage
$128,926
Interest Rate
6.15%
Purchase Details
Closed on
Mar 4, 2005
Sold by
Marie Brown Gladys
Bought by
Ham Construction Inc
Purchase Details
Closed on
Aug 13, 2003
Sold by
Wesley Brown James
Bought by
Marie Brown Gladys
Create a Home Valuation Report for This Property
The Home Valuation Report is an in-depth analysis detailing your home's value as well as a comparison with similar homes in the area
Home Values in the Area
Average Home Value in this Area
Purchase History
| Date | Buyer | Sale Price | Title Company |
|---|---|---|---|
| Crabtree William Earle | $154,900 | -- | |
| Tucker J Hayden | -- | -- | |
| Hayden Tucker J | $130,200 | -- | |
| Ham Construction Inc | $28,000 | -- | |
| Marie Brown Gladys | $50,000 | -- |
Source: Public Records
Mortgage History
| Date | Status | Borrower | Loan Amount |
|---|---|---|---|
| Open | Marie Brown Gladys | $152,093 | |
| Previous Owner | Marie Brown Gladys | $128,926 |
Source: Public Records
Tax History Compared to Growth
Tax History
| Year | Tax Paid | Tax Assessment Tax Assessment Total Assessment is a certain percentage of the fair market value that is determined by local assessors to be the total taxable value of land and additions on the property. | Land | Improvement |
|---|---|---|---|---|
| 2025 | $1,262 | $67,250 | $17,200 | $50,050 |
| 2024 | $1,262 | $67,250 | $17,200 | $50,050 |
| 2023 | $1,273 | $67,875 | $17,200 | $50,675 |
| 2022 | $1,097 | $67,875 | $17,200 | $50,675 |
| 2021 | $1,041 | $46,900 | $13,125 | $33,775 |
| 2020 | $1,041 | $46,900 | $13,125 | $33,775 |
| 2019 | $1,041 | $46,900 | $13,125 | $33,775 |
| 2018 | $985 | $46,900 | $0 | $0 |
| 2017 | $958 | $35,750 | $0 | $0 |
| 2016 | $958 | $35,750 | $0 | $0 |
| 2015 | $958 | $35,750 | $0 | $0 |
| 2014 | $889 | $35,750 | $0 | $0 |
| 2013 | -- | $34,550 | $0 | $0 |
Source: Public Records
Map
Nearby Homes
- 123 Juliet Ave
- 2519 E Main St
- 2407 E Main St
- 316 Yearwood Ave
- 5485 John Bragg Hwy
- 3410 E Main St
- 0 Double Springs Rd
- 706 N Rutherford Blvd
- 411 Apollo Dr
- 703 Chickasaw Rd
- 208 Jakes Ave
- 1014 Gleaning Ct
- Ironwood Plan at Farmhouse Downs - Cambridge Collection
- 1017 Gleaning Ct
- Aspen Plan at Farmhouse Downs - Cambridge Collection
- Alan Plan at Farmhouse Downs - Cambridge Collection
- 1013 Gleaning Ct
- 1010 Gleaning Ct
- Broadmoor Plan at Farmhouse Downs - Cambridge Collection
- 1907 Wren St
- 115 Twin Oak Dr
- 123 Twin Oak Dr
- 118 Twin Oak Dr
- 126 Juliet Ave
- 128 Juliet Ave
- 122 Juliet Ave
- 113 Twin Oak Dr
- 125 Twin Oak Dr
- 122 Twin Oak Dr
- 120 Twin Oak Dr
- 118 Juliet Ave
- 116 Twin Oak Dr
- 124 Twin Oak Dr
- 114 Twin Oak Dr
- 111 Twin Oak Dr
- 126 Twin Oak Dr
- 114 Juliet Ave
- 109 Twin Oak Dr
- 202 Juliet Ave
- 104 Brink Bend Ct