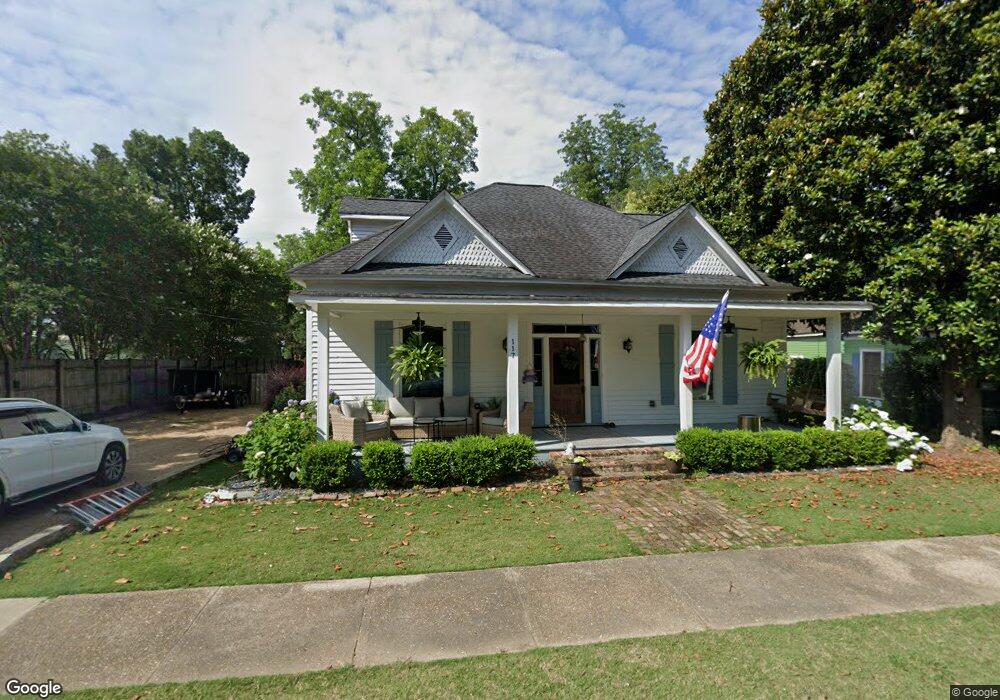
117 W Main St Rutledge, GA 30663
Estimated Value: $484,915 - $647,000
4
Beds
4
Baths
3,098
Sq Ft
$187/Sq Ft
Est. Value
About This Home
This home is located at 117 W Main St, Rutledge, GA 30663 and is currently estimated at $578,229, approximately $186 per square foot. 117 W Main St is a home located in Morgan County with nearby schools including Morgan County Primary School, Morgan County Elementary School, and Morgan County Middle School.
Ownership History
Date
Name
Owned For
Owner Type
Purchase Details
Closed on
Oct 25, 2021
Sold by
Kennedy Jenny W
Bought by
Kennedy Jenny W and Kennedy Justin Terry
Current Estimated Value
Purchase Details
Closed on
Sep 27, 2016
Sold by
Justin T
Bought by
Kennedy Jenny W
Home Financials for this Owner
Home Financials are based on the most recent Mortgage that was taken out on this home.
Original Mortgage
$190,000
Interest Rate
3.46%
Mortgage Type
Purchase Money Mortgage
Purchase Details
Closed on
Oct 3, 2014
Sold by
Turk Linda C
Bought by
Kennedy Terry and Kennedy Justin T
Purchase Details
Closed on
Sep 23, 2014
Sold by
Turk Richard T
Bought by
Turk Linda C
Purchase Details
Closed on
Sep 19, 2014
Sold by
Tuck John G
Bought by
Turk Linda C
Purchase Details
Closed on
Mar 31, 1983
Sold by
Tamplin Thomas Bruce
Bought by
Turk Richard T
Create a Home Valuation Report for This Property
The Home Valuation Report is an in-depth analysis detailing your home's value as well as a comparison with similar homes in the area
Home Values in the Area
Average Home Value in this Area
Purchase History
| Date | Buyer | Sale Price | Title Company |
|---|---|---|---|
| Kennedy Jenny W | -- | -- | |
| Mayberry Rtl Properties Llc | $16,000 | -- | |
| Kennedy Jenny W | -- | -- | |
| Kennedy Terry | $10,000 | -- | |
| Turk Linda C | -- | -- | |
| Turk Linda C | -- | -- | |
| Turk Linda C | -- | -- | |
| Turk Richard T | $31,000 | -- |
Source: Public Records
Mortgage History
| Date | Status | Borrower | Loan Amount |
|---|---|---|---|
| Previous Owner | Kennedy Jenny W | $190,000 |
Source: Public Records
Tax History Compared to Growth
Tax History
| Year | Tax Paid | Tax Assessment Tax Assessment Total Assessment is a certain percentage of the fair market value that is determined by local assessors to be the total taxable value of land and additions on the property. | Land | Improvement |
|---|---|---|---|---|
| 2025 | $3,844 | $164,763 | $15,200 | $149,563 |
| 2024 | $3,906 | $153,146 | $15,200 | $137,946 |
| 2023 | $3,610 | $137,478 | $13,600 | $123,878 |
| 2022 | $3,568 | $130,765 | $13,600 | $117,165 |
| 2021 | $2,612 | $95,815 | $8,000 | $87,815 |
| 2020 | $2,582 | $93,815 | $6,000 | $87,815 |
| 2019 | $2,621 | $93,815 | $6,000 | $87,815 |
| 2018 | $2,659 | $93,815 | $6,000 | $87,815 |
| 2017 | $537 | $18,317 | $6,000 | $12,317 |
| 2016 | $316 | $10,501 | $6,000 | $4,501 |
| 2015 | $122 | $14,200 | $4,000 | $10,200 |
| 2014 | $686 | $23,036 | $4,000 | $19,036 |
| 2013 | -- | $18,280 | $4,000 | $14,280 |
Source: Public Records
Map
Nearby Homes
- 224 Hollis St
- 120 Hidden Falls Ct
- 0 Fairplay St Unit 10637174
- 0 Hawkins Academy Rd Unit 10561655
- 5761 W Dixie Hwy
- 294 Tuscany Dr
- 5521 Atlanta Hwy
- 0 Reese Rd Unit 10622381
- 0 Reese Rd Unit 25651133
- 0 W Dixie Hwy Unit 10499573
- 1151 Fears Rd
- 5841 Atlanta Hwy
- 5187 Parkview Rd
- 3641 Davis Academy Rd
- 25 Browning Shoals Rd
- 745 Amber Lakes Ct Unit 2
- 00 Fears Rd
- 00 Fears Rd
- 1310 Deerwood Dr
- 1031 Graham Dr