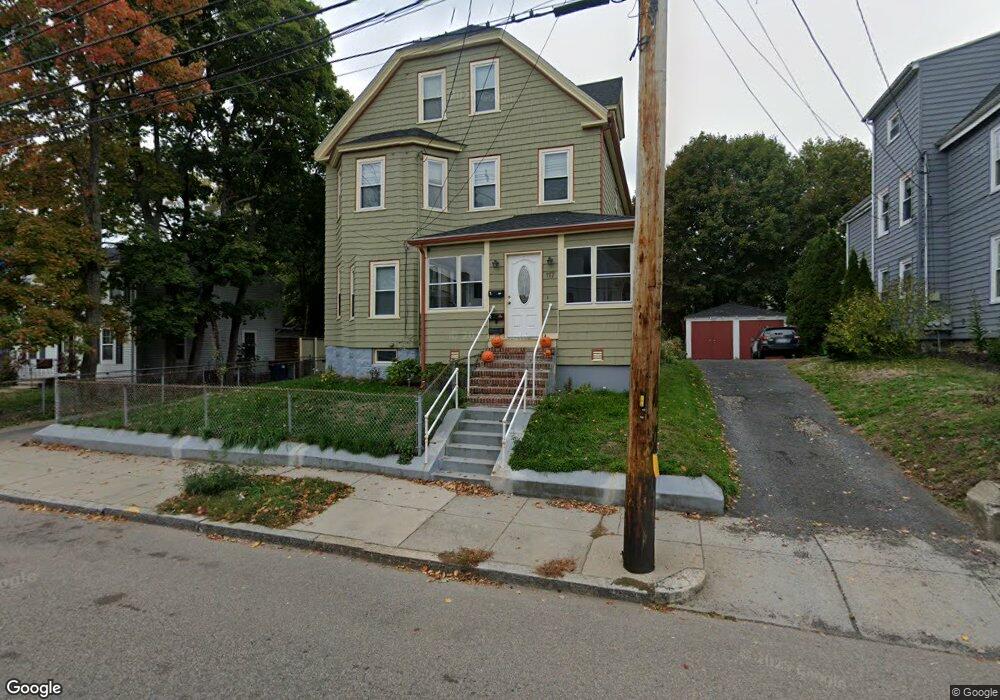
117 Walworth St Roslindale, MA 02131
Roslindale NeighborhoodEstimated Value: $682,863 - $1,019,000
6
Beds
3
Baths
2,074
Sq Ft
$405/Sq Ft
Est. Value
About This Home
This home is located at 117 Walworth St, Roslindale, MA 02131 and is currently estimated at $839,966, approximately $404 per square foot. 117 Walworth St is a home located in Suffolk County with nearby schools including Brooke Charter School Roslindale, Holy Name Parish School, and Sacred Heart STEM School.
Ownership History
Date
Name
Owned For
Owner Type
Purchase Details
Closed on
Nov 14, 2008
Sold by
Fuller Debra A and Rubins Pamela J
Bought by
Estrada Arturo and Estrada Javier
Current Estimated Value
Home Financials for this Owner
Home Financials are based on the most recent Mortgage that was taken out on this home.
Original Mortgage
$301,027
Outstanding Balance
$198,089
Interest Rate
6.13%
Mortgage Type
Purchase Money Mortgage
Estimated Equity
$641,877
Purchase Details
Closed on
Apr 29, 1988
Sold by
Rofe Henry J
Bought by
Smalley Lynwood L
Create a Home Valuation Report for This Property
The Home Valuation Report is an in-depth analysis detailing your home's value as well as a comparison with similar homes in the area
Home Values in the Area
Average Home Value in this Area
Purchase History
| Date | Buyer | Sale Price | Title Company |
|---|---|---|---|
| Estrada Arturo | $305,000 | -- | |
| Smalley Lynwood L | $138,000 | -- |
Source: Public Records
Mortgage History
| Date | Status | Borrower | Loan Amount |
|---|---|---|---|
| Open | Estrada Arturo | $301,027 |
Source: Public Records
Tax History Compared to Growth
Tax History
| Year | Tax Paid | Tax Assessment Tax Assessment Total Assessment is a certain percentage of the fair market value that is determined by local assessors to be the total taxable value of land and additions on the property. | Land | Improvement |
|---|---|---|---|---|
| 2025 | $9,944 | $858,700 | $308,800 | $549,900 |
| 2024 | $8,436 | $773,900 | $275,200 | $498,700 |
| 2023 | $8,312 | $773,900 | $275,200 | $498,700 |
| 2022 | $7,870 | $723,300 | $257,200 | $466,100 |
| 2021 | $7,494 | $702,300 | $249,700 | $452,600 |
| 2020 | $6,578 | $622,900 | $242,900 | $380,000 |
| 2019 | $6,198 | $588,000 | $183,400 | $404,600 |
| 2018 | $5,604 | $534,700 | $183,400 | $351,300 |
| 2017 | $5,444 | $514,100 | $183,400 | $330,700 |
| 2016 | $5,141 | $467,400 | $183,400 | $284,000 |
| 2015 | $4,694 | $387,600 | $170,400 | $217,200 |
| 2014 | $4,734 | $376,300 | $170,400 | $205,900 |
Source: Public Records
Map
Nearby Homes
- 105 Orange St
- 276 Cornell St
- 34 Averton St
- 40 Newburg St Unit 1
- 142 Birch St
- 142 Birch St Unit 2
- 142 Birch St Unit 1
- 59 Aldrich St Unit 2
- 43 Aldrich St
- 15 Newburg St Unit 1
- 80 Roslindale Ave Unit 3
- 6 Hayes Rd Unit 16
- 52 Metropolitan Ave Unit 3
- 242 Belgrade Ave
- 69 Metropolitan Ave
- 103 Belgrade Ave Unit 2
- 29 Rosecliff St
- 150 Aldrich St
- 82 Birch St Unit 1
- 257 Belgrade Ave
- 121 Walworth St
- 111 Walworth St
- 111 Walworth St Unit 2
- 82 Orange St
- 125 Walworth St
- 86 Orange St
- 76 Orange St
- 6 Hillock St
- 4 Hillock St
- 120 Walworth St
- 120 Walworth St Unit 1
- 118 Walworth St
- 90 Orange St
- 114 Walworth St
- 12 Hillock St
- 122 Walworth St
- 72 Orange St
- 129 Walworth St
- 126 Walworth St
- 94 Orange St