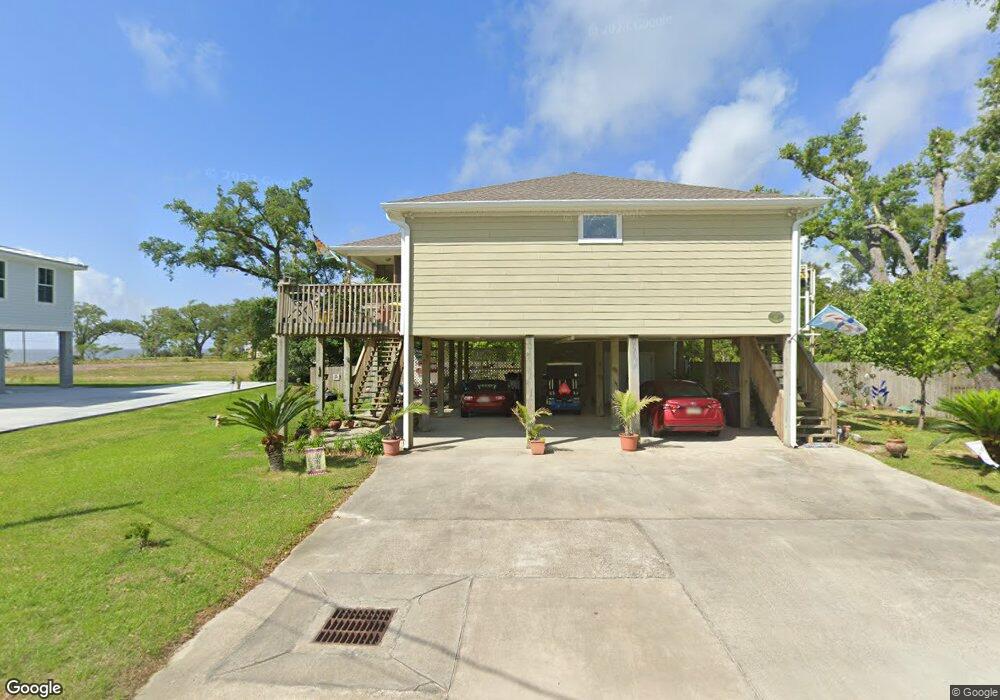
117 Waveland Ave Waveland, MS 39576
Estimated Value: $340,000 - $373,000
3
Beds
1
Bath
2,399
Sq Ft
$147/Sq Ft
Est. Value
About This Home
This home is located at 117 Waveland Ave, Waveland, MS 39576 and is currently estimated at $353,807, approximately $147 per square foot. 117 Waveland Ave is a home located in Hancock County with nearby schools including Waveland Elementary School, North Bay Elementary School, and Bay Waveland Middle School.
Ownership History
Date
Name
Owned For
Owner Type
Purchase Details
Closed on
Jul 25, 2023
Sold by
Dbs Custom Homes And Development Llc
Bought by
Heverly Terry A
Current Estimated Value
Purchase Details
Closed on
Jul 24, 2023
Sold by
Affordable Homes & Land Llc
Bought by
Chatry John Stephen
Purchase Details
Closed on
Jul 20, 2023
Sold by
Bernard Gloria
Bought by
Nicosia Pamela
Create a Home Valuation Report for This Property
The Home Valuation Report is an in-depth analysis detailing your home's value as well as a comparison with similar homes in the area
Home Values in the Area
Average Home Value in this Area
Purchase History
| Date | Buyer | Sale Price | Title Company |
|---|---|---|---|
| Heverly Terry A | -- | None Listed On Document | |
| Heverly Terry A | -- | None Listed On Document | |
| Chatry John Stephen | -- | None Listed On Document | |
| Chatry John Stephen | -- | None Listed On Document | |
| Nicosia Pamela | -- | None Listed On Document | |
| Nicosia Pamela | -- | None Listed On Document |
Source: Public Records
Tax History Compared to Growth
Tax History
| Year | Tax Paid | Tax Assessment Tax Assessment Total Assessment is a certain percentage of the fair market value that is determined by local assessors to be the total taxable value of land and additions on the property. | Land | Improvement |
|---|---|---|---|---|
| 2024 | $2,005 | $15,938 | $2,134 | $13,804 |
| 2023 | $2,005 | $15,938 | $2,134 | $13,804 |
| 2022 | $865 | $14,377 | $2,134 | $12,243 |
| 2021 | $857 | $14,377 | $2,134 | $12,243 |
| 2020 | $1,640 | $14,377 | $2,134 | $12,243 |
| 2019 | $1,628 | $14,377 | $2,134 | $12,243 |
| 2018 | $1,628 | $14,377 | $2,134 | $12,243 |
| 2017 | $1,628 | $14,377 | $2,134 | $12,243 |
| 2016 | $1,514 | $13,377 | $1,120 | $12,257 |
| 2015 | $1,470 | $13,382 | $2,240 | $11,142 |
| 2014 | $1,390 | $13,382 | $2,240 | $11,142 |
| 2013 | $1,347 | $13,382 | $2,240 | $11,142 |
Source: Public Records
Map
Nearby Homes
- 518 S Beach Blvd
- 118 Waveland Ave
- 606 S Beach Blvd
- 137 Oak Blvd
- 108 Market St
- 169 Waveland Ave
- 205 Pine Ridge Dr
- 300 Market St
- 210 Pine Ridge Dr
- 200 Farrar Ln
- 123 Old Pecan Grove Ln
- 307 Water St
- 206 Gulf Dr
- 000 Pine Ridge Dr
- Parcel 3 Surf St
- Parcel 4 Surf St
- 319 Water St
- 321 Water St
- Parcel 1 Sandy St
- 0 Sandy St
- 103 Waveland Ave
- 104 Waveland Ave
- 106 Waveland Ave
- 106 Waveland Ave
- 119 Waveland Ave
- 108 Waveland Ave
- 540 S Beach Blvd
- 600 S Beach Blvd
- 110 Waveland Ave
- 538 S Beach Blvd
- 532 S Beach Blvd
- 121 Waveland Ave
- 612 S Beach Blvd
- LOT 74 S Lot 74 Beach Blvd
- 616 S Beach Blvd
- 116 Waveland Ave
- 116 Waveland Ave
- 131 Waveland Ave
- 620 S Beach Blvd
- 112 Market St