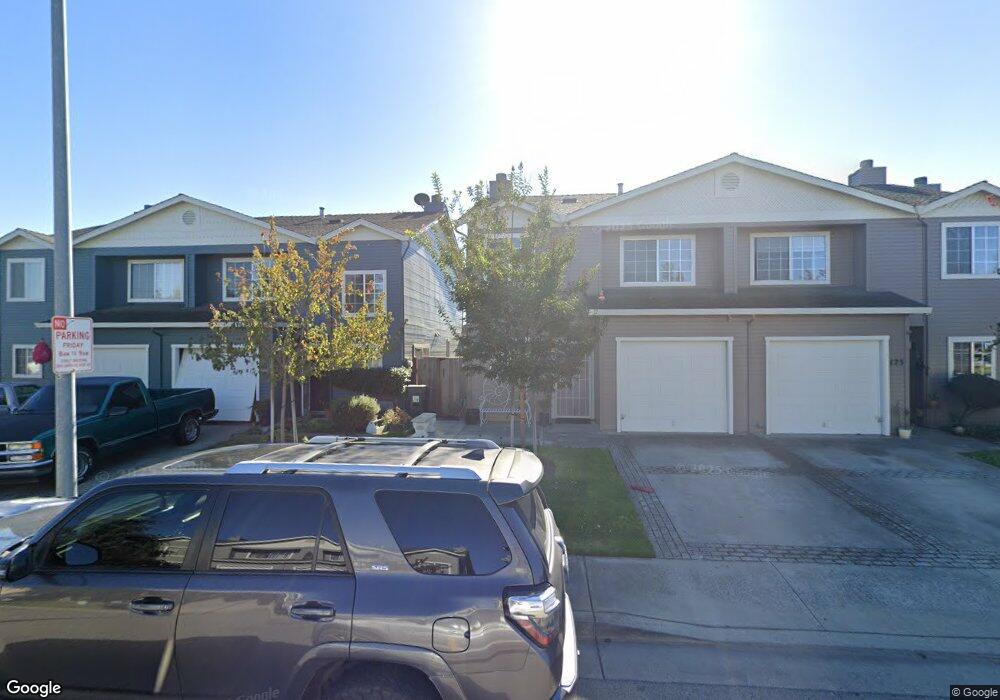
117 Weeks Dr Watsonville, CA 95076
Estimated Value: $506,927 - $729,000
2
Beds
2
Baths
1,136
Sq Ft
$534/Sq Ft
Est. Value
About This Home
This home is located at 117 Weeks Dr, Watsonville, CA 95076 and is currently estimated at $606,232, approximately $533 per square foot. 117 Weeks Dr is a home located in Santa Cruz County with nearby schools including Ann Soldo Elementary School, Lakeview Middle School, and Watsonville High School.
Ownership History
Date
Name
Owned For
Owner Type
Purchase Details
Closed on
Nov 6, 2018
Sold by
Gonzales Richard G and Gonzales Christina A
Bought by
Gonzales Ricardo G and Gonzales Christina A
Current Estimated Value
Purchase Details
Closed on
Dec 12, 1996
Sold by
So Jane K
Bought by
Gonzales Richard G and Gonzales Christina
Home Financials for this Owner
Home Financials are based on the most recent Mortgage that was taken out on this home.
Original Mortgage
$126,000
Outstanding Balance
$12,681
Interest Rate
7.59%
Estimated Equity
$593,551
Create a Home Valuation Report for This Property
The Home Valuation Report is an in-depth analysis detailing your home's value as well as a comparison with similar homes in the area
Home Values in the Area
Average Home Value in this Area
Purchase History
| Date | Buyer | Sale Price | Title Company |
|---|---|---|---|
| Gonzales Ricardo G | -- | None Available | |
| Gonzales Richard G | $140,000 | First American Title Ins Co |
Source: Public Records
Mortgage History
| Date | Status | Borrower | Loan Amount |
|---|---|---|---|
| Open | Gonzales Richard G | $126,000 |
Source: Public Records
Tax History
| Year | Tax Paid | Tax Assessment Tax Assessment Total Assessment is a certain percentage of the fair market value that is determined by local assessors to be the total taxable value of land and additions on the property. | Land | Improvement |
|---|---|---|---|---|
| 2025 | $2,713 | $228,022 | $97,725 | $130,297 |
| 2023 | $2,671 | $219,168 | $93,930 | $125,238 |
| 2022 | $2,624 | $214,871 | $92,089 | $122,782 |
| 2021 | $2,579 | $210,657 | $90,283 | $120,374 |
| 2020 | $2,543 | $208,497 | $89,357 | $119,140 |
| 2019 | $2,498 | $204,409 | $87,605 | $116,804 |
| 2018 | $2,435 | $200,401 | $85,887 | $114,514 |
| 2017 | $2,414 | $196,471 | $84,203 | $112,268 |
| 2016 | $2,351 | $192,619 | $82,552 | $110,067 |
| 2015 | $2,343 | $189,726 | $81,312 | $108,414 |
| 2014 | $2,293 | $186,009 | $79,719 | $106,290 |
Source: Public Records
Map
Nearby Homes
Your Personal Tour Guide
Ask me questions while you tour the home.