
Seller's Agent in 2025
Karlyn Cyr
Berkshire Hathaway Home Services
(860) 919-0709
20 in this area
72 Total Sales
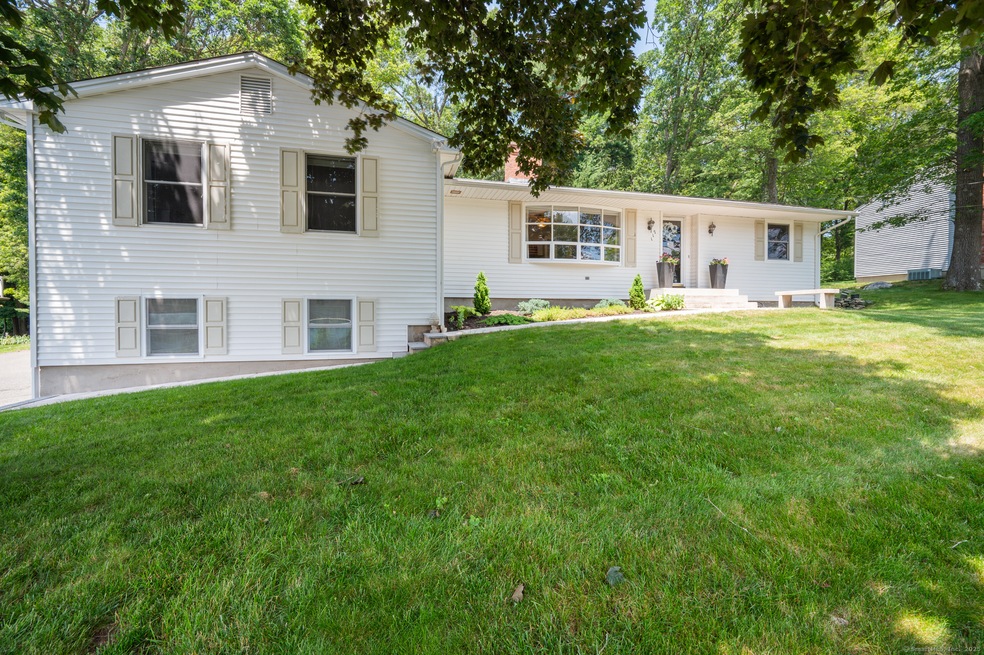
Welcome to 117 Woodfield Rd - a bold blend of comfort and style! This beautifully well maintained home features an open floor plan, perfect for entertaining and everyday comfort. With 3 cozy fireplaces, you'll enjoy warmth and character in multiple living spaces. Offering 3 bedrooms, a stylish kitchen, and sun-drenched rooms throughout, this home is designed to impress. Step outside to a private backyard oasis ideal for relaxing or hosting. Located in a quiet cul-de-sac Bristol neighborhood - this is the one you've been waiting for. Move-in ready - don't miss out!
Last Agent to Sell the Property
Berkshire Hathaway NE Prop. License #RES.0804144 Listed on: 06/25/2025
| Date | Type | Sale Price | Title Company |
|---|---|---|---|
| Warranty Deed | $450,000 | -- | |
| Warranty Deed | $131,000 | -- | |
| Warranty Deed | $131,000 | -- |
| Date | Status | Loan Amount | Loan Type |
|---|---|---|---|
| Open | $412,087 | Future Advance Clause Open End Mortgage | |
| Previous Owner | $195,341 | Stand Alone Refi Refinance Of Original Loan | |
| Previous Owner | $110,000 | No Value Available | |
| Previous Owner | $101,000 | No Value Available | |
| Previous Owner | $104,800 | Purchase Money Mortgage |
| Date | Event | Price | List to Sale | Price per Sq Ft |
|---|---|---|---|---|
| 08/04/2025 08/04/25 | Sold | $450,000 | +5.9% | $217 / Sq Ft |
| 07/03/2025 07/03/25 | Pending | -- | -- | -- |
| 06/28/2025 06/28/25 | For Sale | $425,000 | -- | $205 / Sq Ft |
| Year | Tax Paid | Tax Assessment Tax Assessment Total Assessment is a certain percentage of the fair market value that is determined by local assessors to be the total taxable value of land and additions on the property. | Land | Improvement |
|---|---|---|---|---|
| 2025 | $7,926 | $234,850 | $46,340 | $188,510 |
| 2024 | $7,478 | $234,780 | $46,340 | $188,440 |
| 2023 | $7,126 | $234,780 | $46,340 | $188,440 |
| 2022 | $6,496 | $169,400 | $38,640 | $130,760 |
| 2021 | $6,496 | $169,400 | $38,640 | $130,760 |
| 2020 | $6,496 | $169,400 | $38,640 | $130,760 |
| 2019 | $6,446 | $169,400 | $38,640 | $130,760 |
| 2018 | $6,247 | $169,400 | $38,640 | $130,760 |
| 2017 | $5,995 | $166,390 | $48,300 | $118,090 |
| 2016 | $5,995 | $166,390 | $48,300 | $118,090 |
| 2015 | $5,759 | $166,390 | $48,300 | $118,090 |
| 2014 | $5,759 | $166,390 | $48,300 | $118,090 |
Seller's Agent in 2025
Karlyn Cyr
Berkshire Hathaway Home Services
(860) 919-0709
20 in this area
72 Total Sales
Buyer's Agent in 2025
Laurie Murray
KW Legacy Partners
(860) 212-8305
2 in this area
134 Total Sales
Source: SmartMLS
MLS Number: 24105863
APN: BRIS-000056-000000-000011-168548
Disclaimer: Certain information contained herein is derived from information provided by parties other than Homes.com. All information provided is deemed reliable, but is not guaranteed to be accurate and should be independently verified.
![]() IDX information is provided exclusively for personal, non-commercial use, and may not be used for any purpose other than to identify prospective properties consumers may be interested in purchasing. Information is deemed reliable but not guaranteed.
IDX information is provided exclusively for personal, non-commercial use, and may not be used for any purpose other than to identify prospective properties consumers may be interested in purchasing. Information is deemed reliable but not guaranteed.