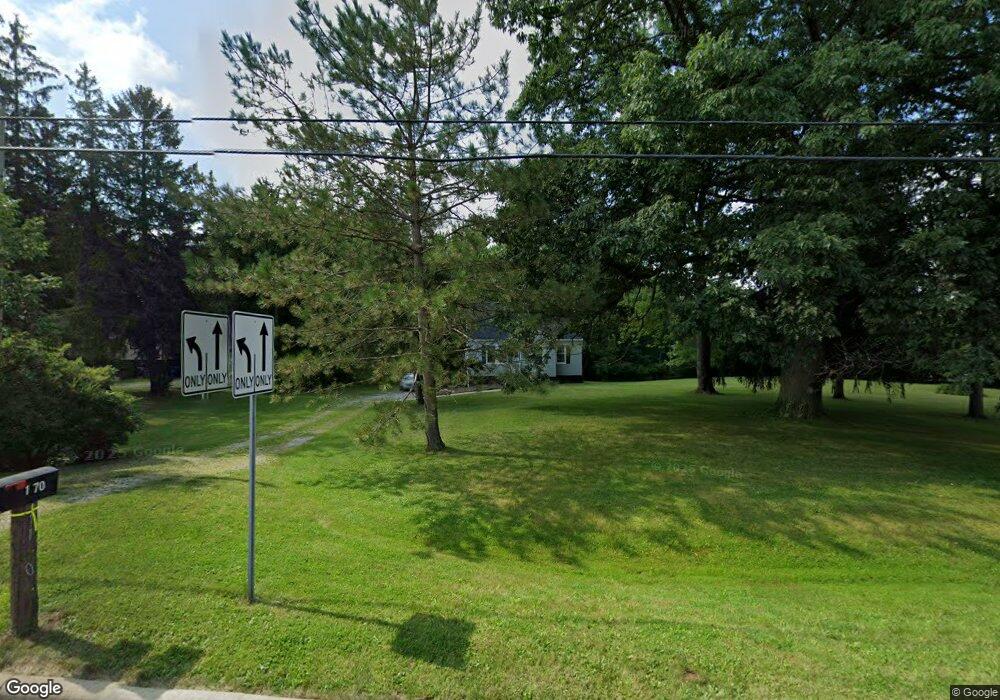
1170 E Aurora Rd MacEdonia, OH 44056
Estimated Value: $237,159 - $282,000
3
Beds
1
Bath
714
Sq Ft
$366/Sq Ft
Est. Value
About This Home
This home is located at 1170 E Aurora Rd, MacEdonia, OH 44056 and is currently estimated at $261,290, approximately $365 per square foot. 1170 E Aurora Rd is a home located in Summit County with nearby schools including Lee Eaton Elementary School, Nordonia Middle School, and Nordonia High School.
Ownership History
Date
Name
Owned For
Owner Type
Purchase Details
Closed on
Dec 19, 2018
Sold by
Robinson Gary A
Bought by
Robinson Gary A and The Gary A Robinson Family Trust
Current Estimated Value
Purchase Details
Closed on
Feb 1, 2002
Sold by
Estate Of Julia Robinson
Bought by
Robinson James Allen and Robinson Gary Arthur
Home Financials for this Owner
Home Financials are based on the most recent Mortgage that was taken out on this home.
Original Mortgage
$48,000
Outstanding Balance
$22,189
Interest Rate
8.75%
Estimated Equity
$239,101
Purchase Details
Closed on
Jan 24, 2002
Sold by
Robinson James Allen
Bought by
Robinson Gary Arthur
Home Financials for this Owner
Home Financials are based on the most recent Mortgage that was taken out on this home.
Original Mortgage
$48,000
Outstanding Balance
$22,189
Interest Rate
8.75%
Estimated Equity
$239,101
Create a Home Valuation Report for This Property
The Home Valuation Report is an in-depth analysis detailing your home's value as well as a comparison with similar homes in the area
Home Values in the Area
Average Home Value in this Area
Purchase History
| Date | Buyer | Sale Price | Title Company |
|---|---|---|---|
| Robinson Gary A | -- | None Available | |
| Robinson James Allen | -- | Real Estate Title | |
| Robinson Gary Arthur | $20,000 | Real Estate Title |
Source: Public Records
Mortgage History
| Date | Status | Borrower | Loan Amount |
|---|---|---|---|
| Open | Robinson Gary Arthur | $48,000 |
Source: Public Records
Tax History
| Year | Tax Paid | Tax Assessment Tax Assessment Total Assessment is a certain percentage of the fair market value that is determined by local assessors to be the total taxable value of land and additions on the property. | Land | Improvement |
|---|---|---|---|---|
| 2024 | $2,313 | $58,681 | $25,760 | $32,921 |
| 2023 | $2,313 | $58,681 | $25,760 | $32,921 |
| 2022 | $2,172 | $46,649 | $20,444 | $26,205 |
| 2021 | $2,179 | $46,649 | $20,444 | $26,205 |
| 2020 | $2,141 | $46,650 | $20,440 | $26,210 |
| 2019 | $2,119 | $42,460 | $27,960 | $14,500 |
| 2018 | $1,829 | $42,460 | $27,960 | $14,500 |
| 2017 | $2,335 | $42,460 | $27,960 | $14,500 |
| 2016 | $2,336 | $40,680 | $27,960 | $12,720 |
| 2015 | $2,335 | $40,680 | $27,960 | $12,720 |
| 2014 | $2,320 | $40,680 | $27,960 | $12,720 |
| 2013 | $2,303 | $40,740 | $27,960 | $12,780 |
Source: Public Records
Map
Nearby Homes
- 8607 Alexis Dr
- 8466 Cliffview Cir
- 1038 Sherwood Dr
- 8559 Pabin Ct
- 1282 Berkshire Dr
- 985 Berkshire Dr
- 8800 Lawton Dr
- 0 Highland Valley View Rd E
- 9268 Shepard Rd
- 9109 Seminole Ln
- 1159 Park Ledge Dr
- VL Shepard Rd
- 1685 Bridget Ln
- SL 1 Chamberlin Rd
- 8539 Primrose Ln
- SL 2 Chamberlin Rd
- 9408 Fairfield Dr
- 293 Beechwood Dr
- 8613 Larkspur Ln
- 2092 Holmes Dr
- 1178 E Aurora Rd
- 1192 E Aurora Rd
- 1154 E Aurora Rd
- 8660 Reserve Ln
- 8657 Reserve Ln
- 8672 Reserve Ln
- 1163 E Aurora Rd
- 8669 Reserve Ln
- 1153 E Aurora Rd
- 8680 Reserve Ln
- 1134 E Aurora Rd
- 8675 Reserve Ln
- 1225 E Aurora Rd
- 1225 1228 E Aurora Rd
- 1226 E Aurora Rd
- 1120 E Aurora Rd
- 8681 Reserve Ln
- 8688 Reserve Ln
- 1249 E Aurora Rd
- 1252 E Aurora Rd
Your Personal Tour Guide
Ask me questions while you tour the home.