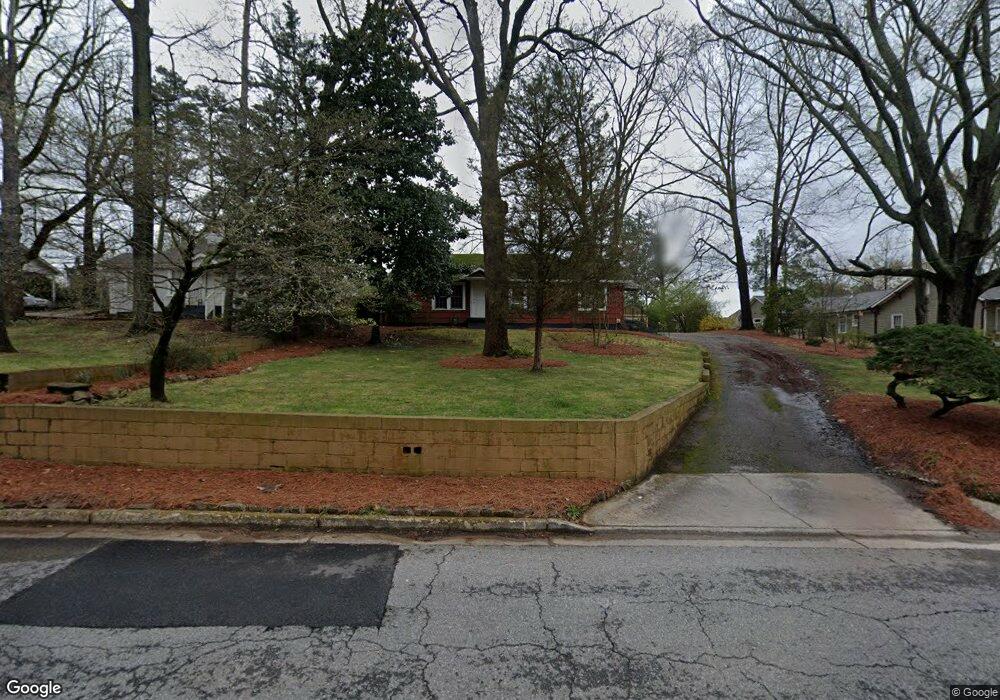
1170 Fleming St SE Smyrna, GA 30080
Estimated Value: $363,914 - $488,000
3
Beds
1
Bath
1,164
Sq Ft
$354/Sq Ft
Est. Value
About This Home
This home is located at 1170 Fleming St SE, Smyrna, GA 30080 and is currently estimated at $411,729, approximately $353 per square foot. 1170 Fleming St SE is a home located in Cobb County with nearby schools including Smyrna Elementary School, Campbell Middle School, and Campbell High School.
Ownership History
Date
Name
Owned For
Owner Type
Purchase Details
Closed on
Mar 22, 2002
Sold by
Hatch Joseph W
Bought by
Thomas John L
Current Estimated Value
Home Financials for this Owner
Home Financials are based on the most recent Mortgage that was taken out on this home.
Original Mortgage
$103,200
Outstanding Balance
$9,946
Interest Rate
7.16%
Mortgage Type
New Conventional
Estimated Equity
$401,783
Purchase Details
Closed on
Oct 28, 1999
Sold by
Jackson Carrol W
Bought by
Hatch Joseph W
Home Financials for this Owner
Home Financials are based on the most recent Mortgage that was taken out on this home.
Original Mortgage
$63,120
Interest Rate
15.5%
Mortgage Type
New Conventional
Purchase Details
Closed on
Oct 23, 1998
Sold by
Chapman Ben F
Bought by
Chapman Benjamin Fields and Chapman Wi
Home Financials for this Owner
Home Financials are based on the most recent Mortgage that was taken out on this home.
Original Mortgage
$46,000
Interest Rate
6.58%
Mortgage Type
New Conventional
Create a Home Valuation Report for This Property
The Home Valuation Report is an in-depth analysis detailing your home's value as well as a comparison with similar homes in the area
Home Values in the Area
Average Home Value in this Area
Purchase History
| Date | Buyer | Sale Price | Title Company |
|---|---|---|---|
| Thomas John L | $115,000 | -- | |
| Hatch Joseph W | $78,900 | -- | |
| Chapman Benjamin Fields | -- | -- |
Source: Public Records
Mortgage History
| Date | Status | Borrower | Loan Amount |
|---|---|---|---|
| Open | Thomas John L | $103,200 | |
| Previous Owner | Hatch Joseph W | $63,120 | |
| Previous Owner | Chapman Benjamin Fields | $46,000 |
Source: Public Records
Tax History Compared to Growth
Tax History
| Year | Tax Paid | Tax Assessment Tax Assessment Total Assessment is a certain percentage of the fair market value that is determined by local assessors to be the total taxable value of land and additions on the property. | Land | Improvement |
|---|---|---|---|---|
| 2025 | $2,914 | $152,332 | $125,276 | $27,056 |
| 2024 | $1,935 | $100,000 | $80,000 | $20,000 |
| 2023 | $1,446 | $100,000 | $80,000 | $20,000 |
| 2022 | $2,110 | $108,320 | $83,516 | $24,804 |
| 2021 | $1,836 | $93,160 | $75,164 | $17,996 |
| 2020 | $1,359 | $68,108 | $50,112 | $17,996 |
| 2019 | $1,359 | $68,108 | $50,112 | $17,996 |
| 2018 | $925 | $45,280 | $29,232 | $16,048 |
| 2017 | $874 | $45,280 | $29,232 | $16,048 |
| 2016 | $780 | $40,300 | $25,056 | $15,244 |
| 2015 | $518 | $29,468 | $12,180 | $17,288 |
| 2014 | $523 | $29,468 | $0 | $0 |
Source: Public Records
Map
Nearby Homes
- 332 Symphony Way
- 3061 Devoncroft St
- 1180 Fleming St SE
- 3005 Devoncroft St SE
- 204 Dellwood Dr SE
- 164 Blakemore Dr SE
- 1058 Kirkland Cir
- 1298 Belmont Ave SE
- 1365 Hawthorne Ave SE
- 1385 Hawthorne Ave SE
- 2771 Guthrie St SE
- 1436 Belmont Ave SE
- 1451 Belmont Ave SE
- 1211 Stephens St SE
- 873 Wayland Ct SE
- 704 Madison Ln SE
- 1202 Madison Ln SE
- 603 Madison Ln SE
- 1482 Whitfield St SE
- 1307 Madison Ln SE
- 1174 Fleming St SE
- 1154 Fleming St SE
- 533 Mirrormont Dr SE
- 529 Mirrormont Dr SE
- 541 Mirrormont Dr
- 525 Mirrormont Dr SE
- 545 Mirrormont Dr SE
- 1195 Hill St SE
- 545 Mirrormont Dr
- 549 Mirrormont Dr SE
- 549 Mirrormont Dr SE Unit 40
- 549 Mirrormont Dr SE
- 1150 Fleming St SE
- 1150 Fleming St SE Unit 1
- 553 Mirrormont Dr
- 521 Mirrormont Dr SE
- 1175 Hill St SE
- 1201 Hill St
- 557 Mirrormont Dr SE Unit 38
- 557 Mirrormont Dr SE