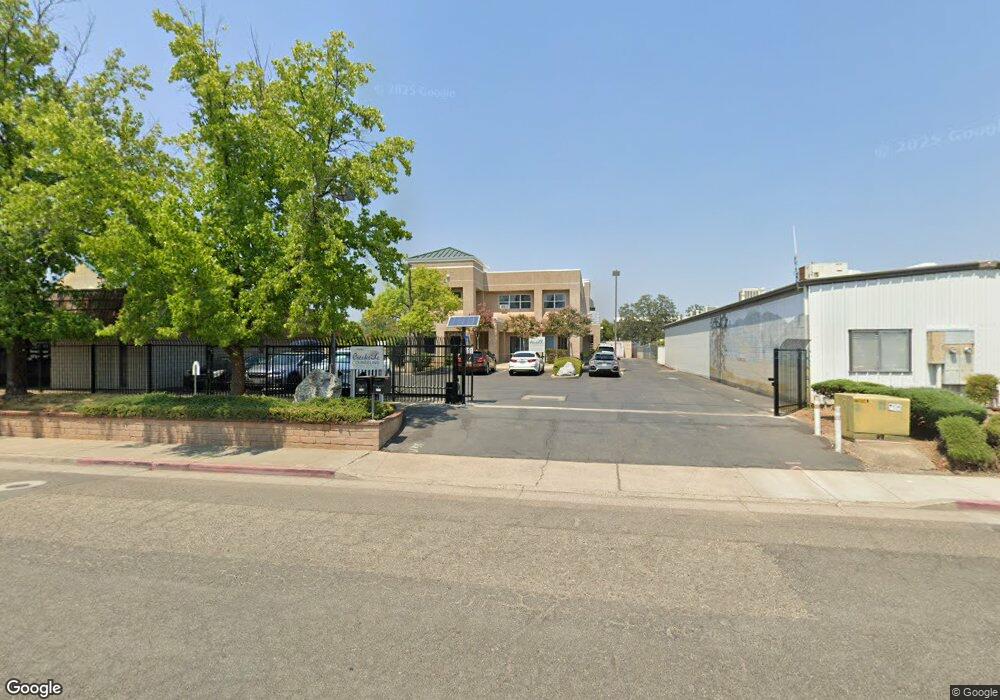
1170 Industrial St Redding, CA 96002
Mistletoe NeighborhoodEstimated Value: $966,636
Studio
3
Baths
1,764
Sq Ft
$548/Sq Ft
Est. Value
About This Home
This home is located at 1170 Industrial St, Redding, CA 96002 and is currently estimated at $966,636, approximately $547 per square foot. 1170 Industrial St is a home located in Shasta County with nearby schools including Mistletoe Elementary School, Enterprise High School, and Trinity Lutheran School.
Ownership History
Date
Name
Owned For
Owner Type
Purchase Details
Closed on
Jan 3, 2006
Sold by
Stimpel Wiebelhaus Inc
Bought by
Industrial Properties Llc
Current Estimated Value
Create a Home Valuation Report for This Property
The Home Valuation Report is an in-depth analysis detailing your home's value as well as a comparison with similar homes in the area
Home Values in the Area
Average Home Value in this Area
Purchase History
| Date | Buyer | Sale Price | Title Company |
|---|---|---|---|
| Industrial Properties Llc | $760,000 | -- |
Source: Public Records
Tax History
| Year | Tax Paid | Tax Assessment Tax Assessment Total Assessment is a certain percentage of the fair market value that is determined by local assessors to be the total taxable value of land and additions on the property. | Land | Improvement |
|---|---|---|---|---|
| 2025 | $11,481 | $1,038,588 | $286,974 | $751,614 |
| 2024 | $11,320 | $1,018,225 | $281,348 | $736,877 |
| 2023 | $11,320 | $998,261 | $275,832 | $722,429 |
| 2022 | $11,004 | $978,688 | $270,424 | $708,264 |
| 2021 | $10,633 | $959,499 | $265,122 | $694,377 |
| 2020 | $9,508 | $850,000 | $300,000 | $550,000 |
| 2019 | $8,848 | $780,000 | $300,000 | $480,000 |
| 2018 | $8,695 | $760,000 | $300,000 | $460,000 |
| 2017 | $8,785 | $740,000 | $300,000 | $440,000 |
| 2016 | $7,840 | $690,000 | $250,000 | $440,000 |
| 2015 | $7,340 | $640,000 | $200,000 | $440,000 |
| 2014 | $7,282 | $625,000 | $200,000 | $425,000 |
Source: Public Records
Map
Nearby Homes
- 1221 E Cypress Ave Unit 93
- 670 Monardas Dr
- 1610 Oakdale Ct
- 1939 Cameo Ct
- 2820 Alfreda Way
- 1701 E Cypress Ave
- 1556 Minor St
- 1968 Bechelli Ln
- 2093 Victor Ave
- 0 Churn Creek Rd Unit 25-496
- 0 Churn Creek Rd Unit 26-609
- 0 Churn Creek Rd Unit 25-5491
- 918 Parsons Dr
- 2906 Regal Ave
- 1877 Wheeler St
- 550 Parsons Dr
- 3178 Lawrence Rd
- 1075 Le Brun Ln
- 1285 Lancers Ln
- 1091 Del Sol Place
- 1168 Industrial St
- 1160 Industrial St
- 1155 Del Monte St Unit B,C,D,E
- 1155 Del Monte St Unit B
- 1155 Del Monte St Unit C,D,E
- 1155 Del Monte St Unit D and E
- 1155 Del Monte St Unit C
- 1155 Del Monte St Unit Ste B
- 1155 Del Monte Ste B St
- 1180 Industrial St
- 1170 Del Monte St
- 1186 Del Monte St
- 1126 Del Monte St
- 2075 Carpenter Ln
- 2065 Carpenter Ln
- 1025 Grissom Ct
- 2245 Churn Creek Rd
- 2221 Churn Creek Rd
- 2185 Churn Creek Rd
- 1201 Industrial St
Your Personal Tour Guide
Ask me questions while you tour the home.